You can agree today to take delivery of a barrel of American crude oil in December, and it will cost you about $99.77. You can agree today to take delivery of that same barrel in December 2035, and it will cost you about $51.82.
Same oil. Same contract. Roughly half the price, nine years out. And the market is not predicting anything.
What you are actually looking at
A futures contract is a promise. You and someone else agree now on a price, and on a specific month when the barrels change hands. There is a separate contract for every month, stretching years into the future, and each one trades at its own price.
Lay them out in order and you get what traders call the curve. On Tuesday morning it looked like this:
| Delivery month | Price | Versus December |
|---|---|---|
| December 2026 | $99.77 | |
| January 2027 | $97.77 | $2.00 less |
| March 2027 | $93.77 | $6.00 less |
| December 2027 | $81.77 | $18.00 less |
| December 2029 | $69.30 | $30.47 less |
| December 2035 | $51.82 | $47.95 less |
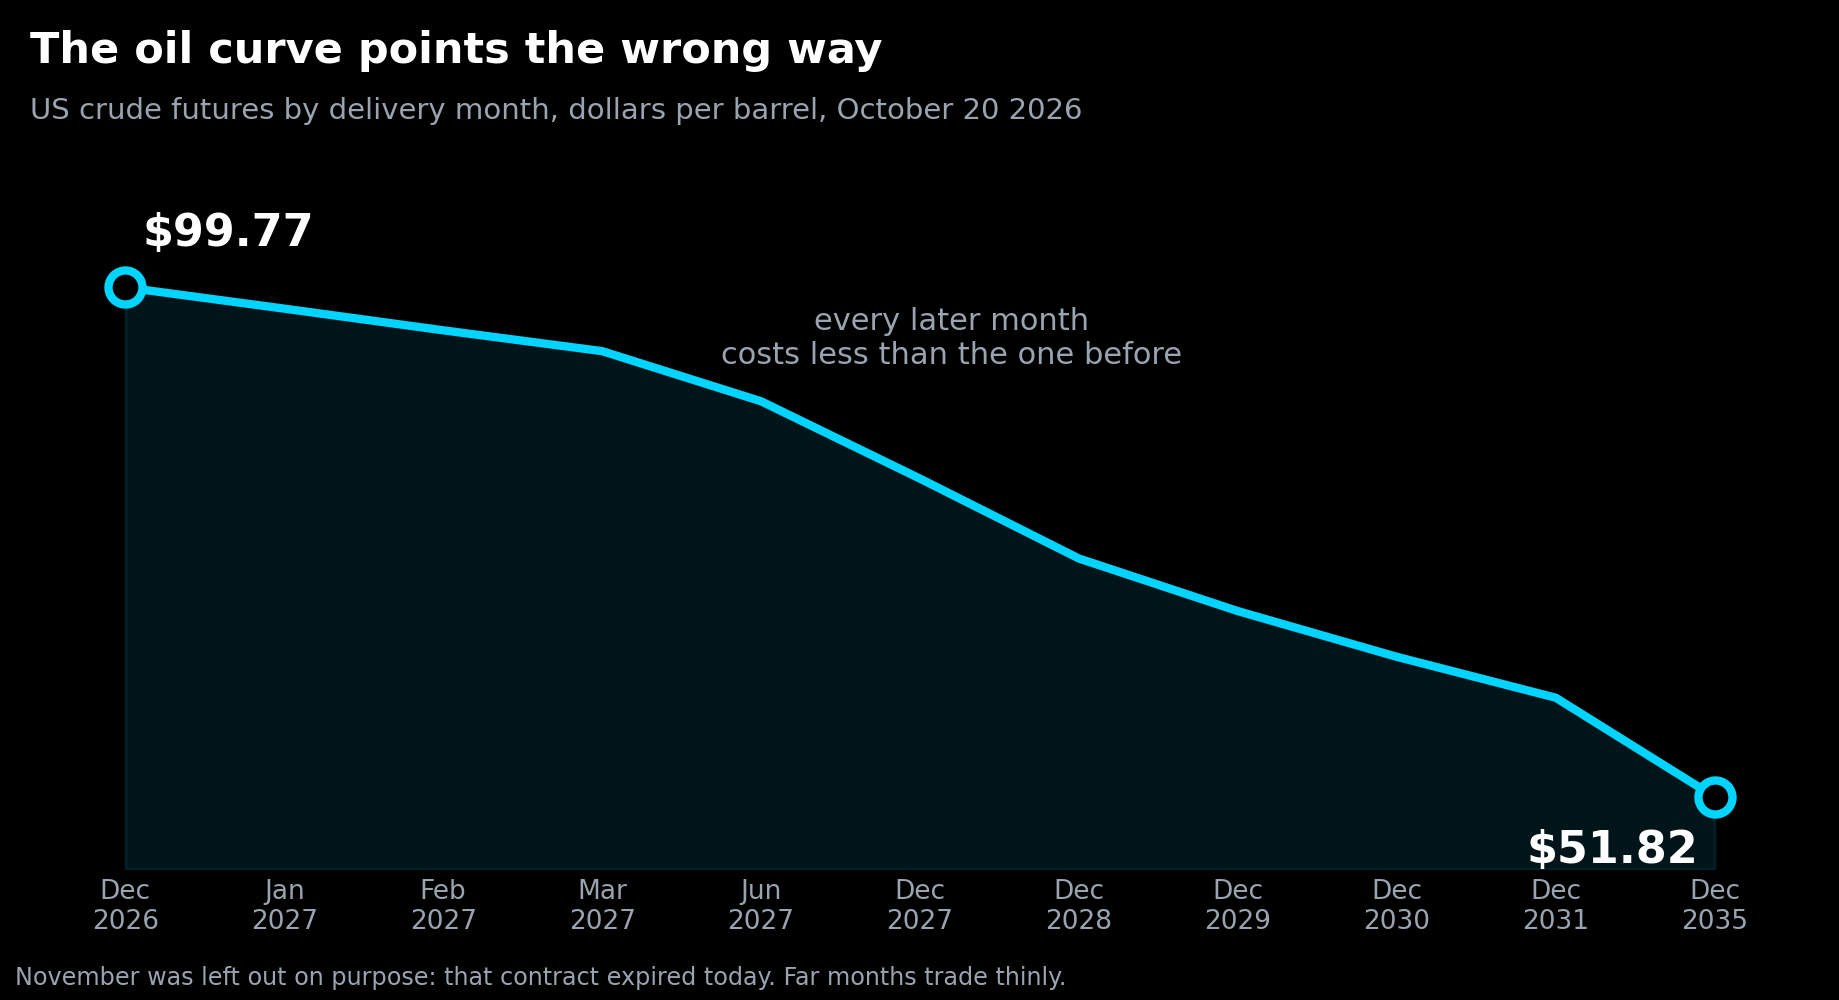
Every step down the list is lower than the one above it. That shape has a name, backwardation, and the ordinary thing to know about it is that it is not ordinary.
Why later should cost more
Think about what it costs to hold a physical barrel of oil for a year. You need a tank. The tank costs rent. The money you spent on the barrel is tied up instead of earning interest somewhere else. Insurance, handling, a little evaporation.
So in a calm market, a barrel delivered next year should cost more than one delivered next month, by roughly the cost of storing it and the cost of the money. That upward slope is the normal state and it has its own name, contango. It is just the price of waiting.
Run the arithmetic on today's market. At $99.77 a barrel, a year of financing alone at something like 5% is about $5 of carry. Add storage on top. A calm market would put December 2027 somewhere above $105.
It is at $81.77.
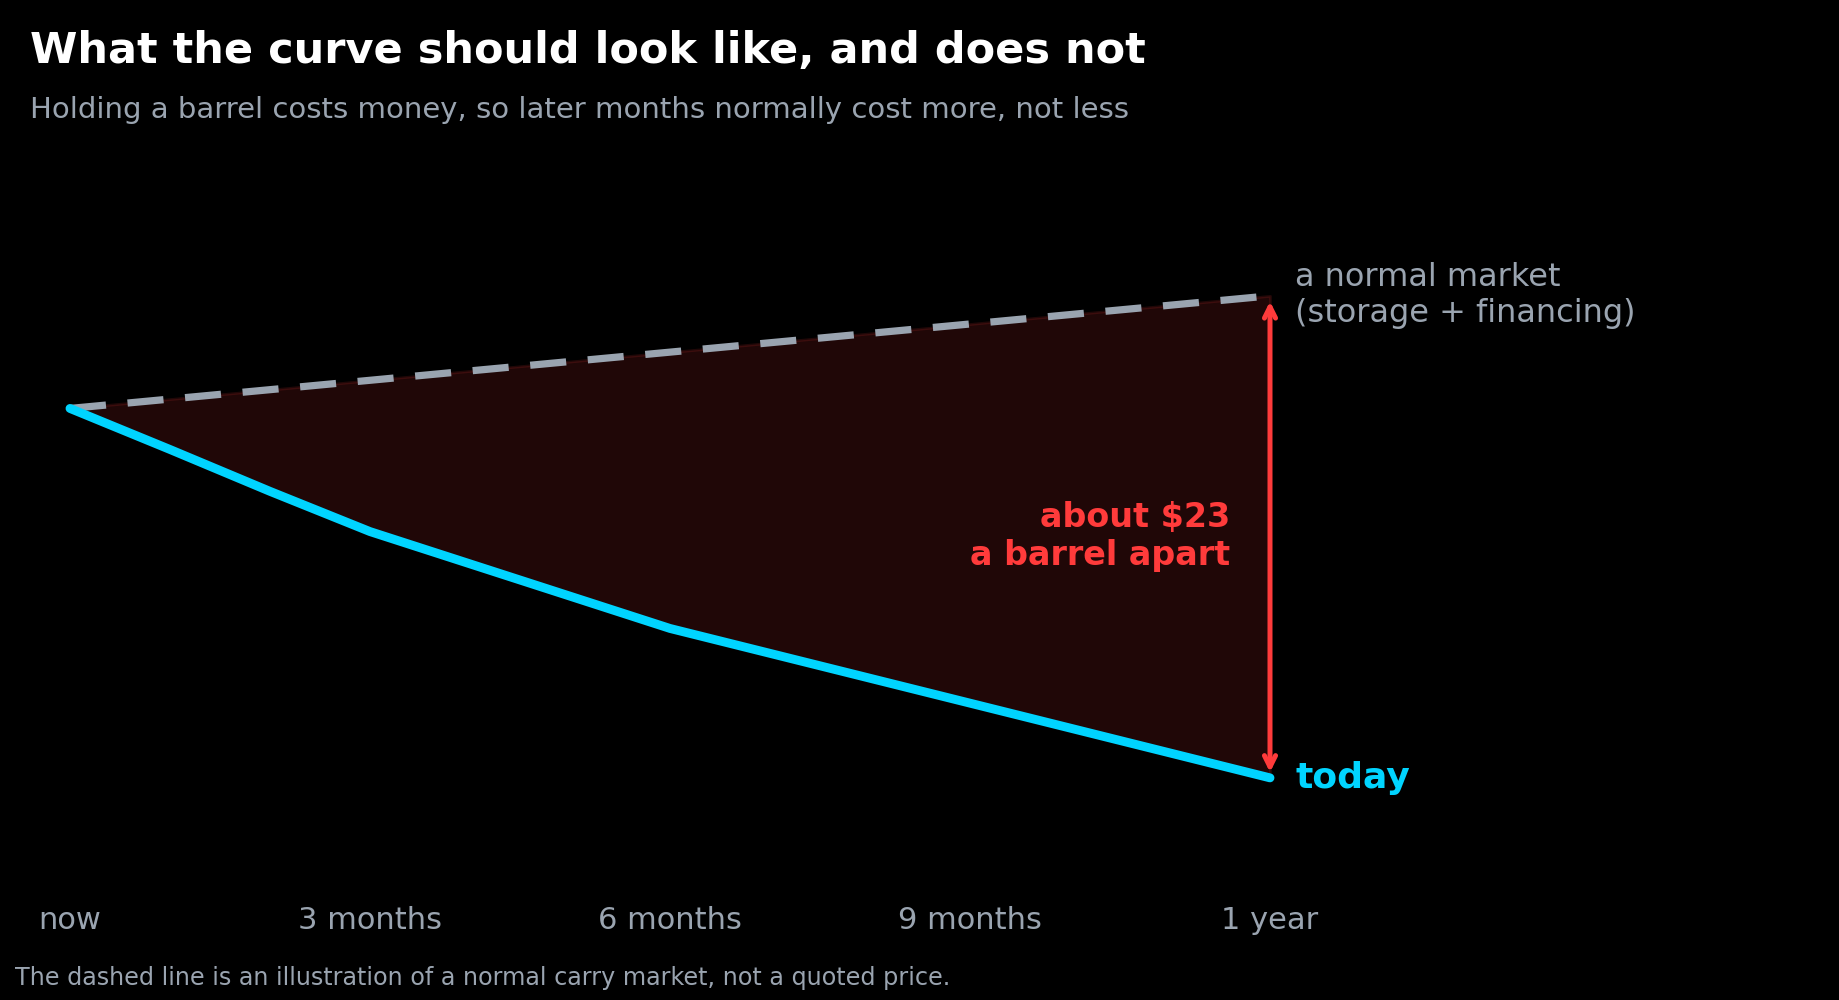
That is $18 below the December 2026 price, and roughly $23 below where a normal carry market would have put it. The curve is not slightly bent. It is pointing the wrong way, hard, and it stays pointed that way for a decade.
What that shape actually means
Here is the useful translation, and it is simpler than the vocabulary suggests.
When a barrel you can get now costs more than a barrel you can get later, somebody is paying a premium for immediate possession. They are not paying it for fun. They are paying it because they need physical oil in a tank or a refinery on a specific date, and there is not enough of it to go around at the moment.
Backwardation is the market charging rent for right now.
That is why it is a more honest signal than the headline price. A headline price moves on fear, on positioning, on a rumour, on somebody's large order. The shape of the curve is harder to fake, because it reflects what people who actually handle barrels are willing to pay to not wait.
And the shape got steeper this week. Iran's Revolutionary Guard threatened to target the undersea communication cables running through the Strait of Hormuz, which has now been closed for months. Brent traded above $110. Every contract on that table rose, but the near ones rose more than the far ones, which is the curve steepening rather than simply lifting.
Why this reaches your life
A curve shape sounds like a traders' problem. It is not, and the reason is hedging.
An airline does not want to find out in March what jet fuel costs in March. Neither does a trucking company, a cruise line, a chemical plant or a farmer running diesel equipment. So they lock the price in advance by agreeing now for a later month. That is what these contracts are for. Speculation gets the attention, but the contracts exist because somebody needs to know their fuel bill before the fuel arrives.
In a normal market that protection is affordable. Next year's barrel costs a little more than today's, so locking in next year costs a small premium over the spot price, and the business absorbs it and moves on.
In a backwardated market it flips. Locking in a later month looks like a discount on paper, which sounds good, and often is good. But the business still has to get through the near months first, and those are the ones carrying the premium. The costly part is now, which is also when the fuel is actually being burned.
So the curve shape shows up in things that have nothing to do with oil. A trucking company facing a costly near month either absorbs it or passes it into freight rates. Freight rates sit inside the price of almost everything that moves on a truck, which is almost everything. That is one of the quiet routes by which a fight over a shipping lane turns into a number on a grocery receipt two months later, and it is why the diesel line in an inflation report so often moves before anything else does.
What this does not tell you
Start with the biggest one, because it is the error this issue most invites.
That $51.82 for December 2035 is not a forecast. Nobody at a trading desk believes they know what oil costs in 2035. Contracts that far out barely trade, and the prices you see there are closer to accounting marks than to real transactions. The far end of the curve is a slope drawn by the near end, not an opinion about the next decade.
Backwardation does not mean prices will fall. It is a statement about scarcity today, not about direction tomorrow. Curves have stayed backwardated for years while the headline price went up. The two things are measuring different questions and they are allowed to disagree.
And one practical trap, which this week demonstrates perfectly. The contract for November delivery expired on Tuesday. If you were watching a chart of "the oil price," what you often get is whichever contract is nearest, stitched end to end. When one expires and the next takes over, the chart jumps by the gap between them. That jump is not oil moving. It is the chart changing which promise it is quoting.
It is the reason this issue uses December as its reference month and leaves November alone entirely. An expiring contract in its final hours is thinly traded and tangled up with delivery mechanics, and a spread measured against it can look dramatic while meaning very little. If you take one habit from this, take that one: when a chart of a commodity gaps for no apparent reason, check the calendar before you check the news.
A price is a single number. A curve is a shape, and shapes carry more information than numbers do. The same is true of a valuation. Techdamentals runs four separate methods on a company rather than producing one figure, and shows the full range they span, because the spread between them tells you how much the answer depends on assumptions. When four methods agree, that is worth knowing. When they do not, that is worth knowing more.