Forty-three percent of American homebuilders cut their prices this month. That is the highest share since at least 2020, and the average cut was 6%, which is exactly what it has been for seven months running.
The survey those numbers come from dropped to its lowest reading since June 2012. Not since last year. Since 2012.
What the number actually is
Once a month, the National Association of Home Builders asks single-family builders three questions. How are sales right now, good, fair or poor. How do you expect sales over the next six months, good, fair or poor. And how is traffic of prospective buyers, high, average or low.
Then it turns the answers into a score from 0 to 100, and here is the part worth knowing, because it is not a percentage and almost everyone reads it as one.
For sales, the formula is the share saying good, minus the share saying poor, plus 100, divided by two. So if every builder said good, you get 100. If every builder said poor, you get 0. If the good answers and the poor answers are evenly matched, you get 50. Fifty is the dividing line, not zero.
The October headline was 29.
Work that backwards and it tells you something a headline cannot. An index of 29 on present sales means the share of builders saying poor exceeds the share saying good by a wide margin. The three pieces:
| Component | October | Change | Good minus poor |
|---|---|---|---|
| Present sales | 33 | down 2 | 34 points more poor |
| Sales expected over six months | 32 | down 5 | 36 points more poor |
| Traffic of prospective buyers | 18 | down 5 | 64 points more poor |
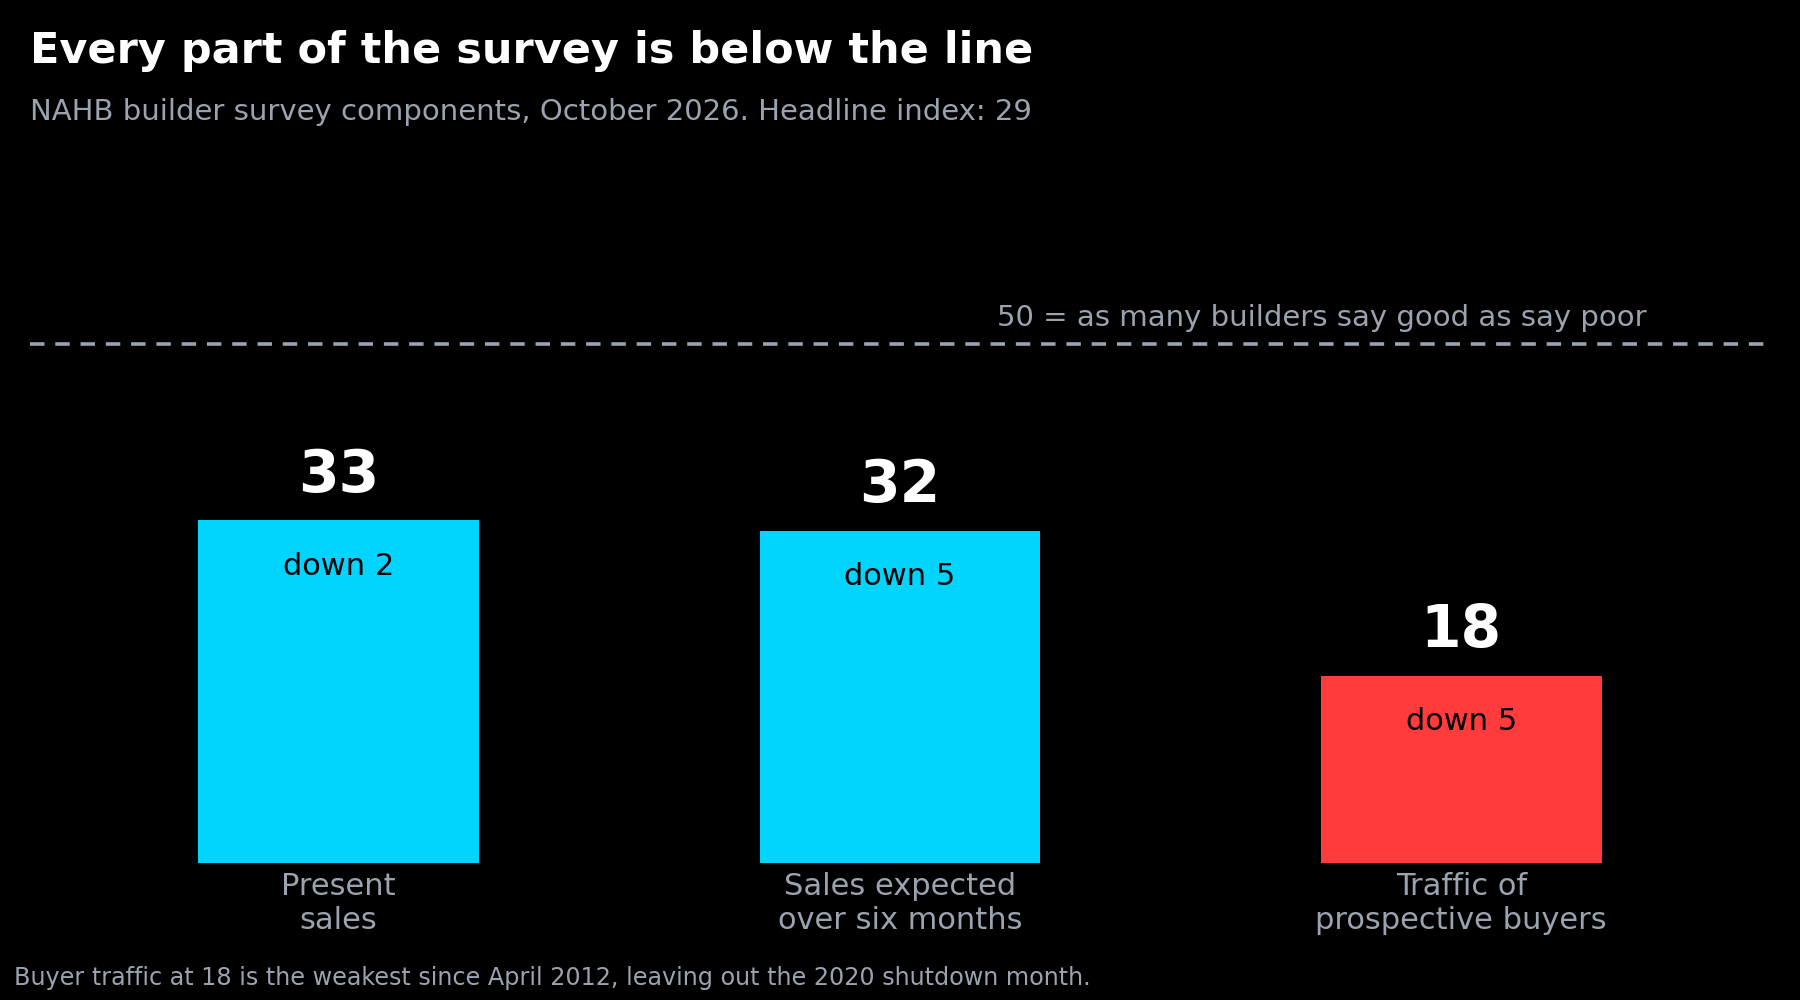
That last row is the one to stare at. An index of 18 means that for every builder describing buyer traffic as high, there are far more describing it as low, by 64 percentage points. The association says it is the weakest traffic reading since April 2012, leaving out the month the economy shut down in 2020.
The three parts are then weighted, with present sales counting for about 59%, traffic for about 27%, and the six-month outlook for about 14%. Run those weights across the three numbers above and you land on 28.8, which rounds to the 29 that got reported. The arithmetic is not hiding anything. The weakness is in the survey itself.
The reason is one number, and it is 7.40%
A year ago the average 30-year fixed mortgage rate in the United States was 6.27%. As of the middle of this month it was 7.40%. The 15-year went from 5.52% to 6.71% over the same stretch.
If your first thought is that the Fed should simply cut rates and fix this, that is the right instinct and the wrong mechanism. The Fed sets an overnight rate between banks. A thirty-year mortgage is priced off long-term bonds, which move on their own expectations about inflation and growth. We took that apart in an earlier issue, and it is the reason the two numbers can move in opposite directions.
That sounds like a small move until you put a dollar figure on it, so here is one.
Take a $400,000 loan on a 30-year fixed. At 6.27%, the monthly principal and interest payment is about $2,468. At 7.40%, it is about $2,770.
That is $301 more per month, or roughly $3,617 a year, for the identical house at the identical price. Nothing about the property changed. Nothing about the family changed. The only thing that moved was the rate, and it quietly removed three hundred dollars a month from what that household can afford to carry.
On a $300,000 loan it is about $226 a month. On a $600,000 loan it is over $450.
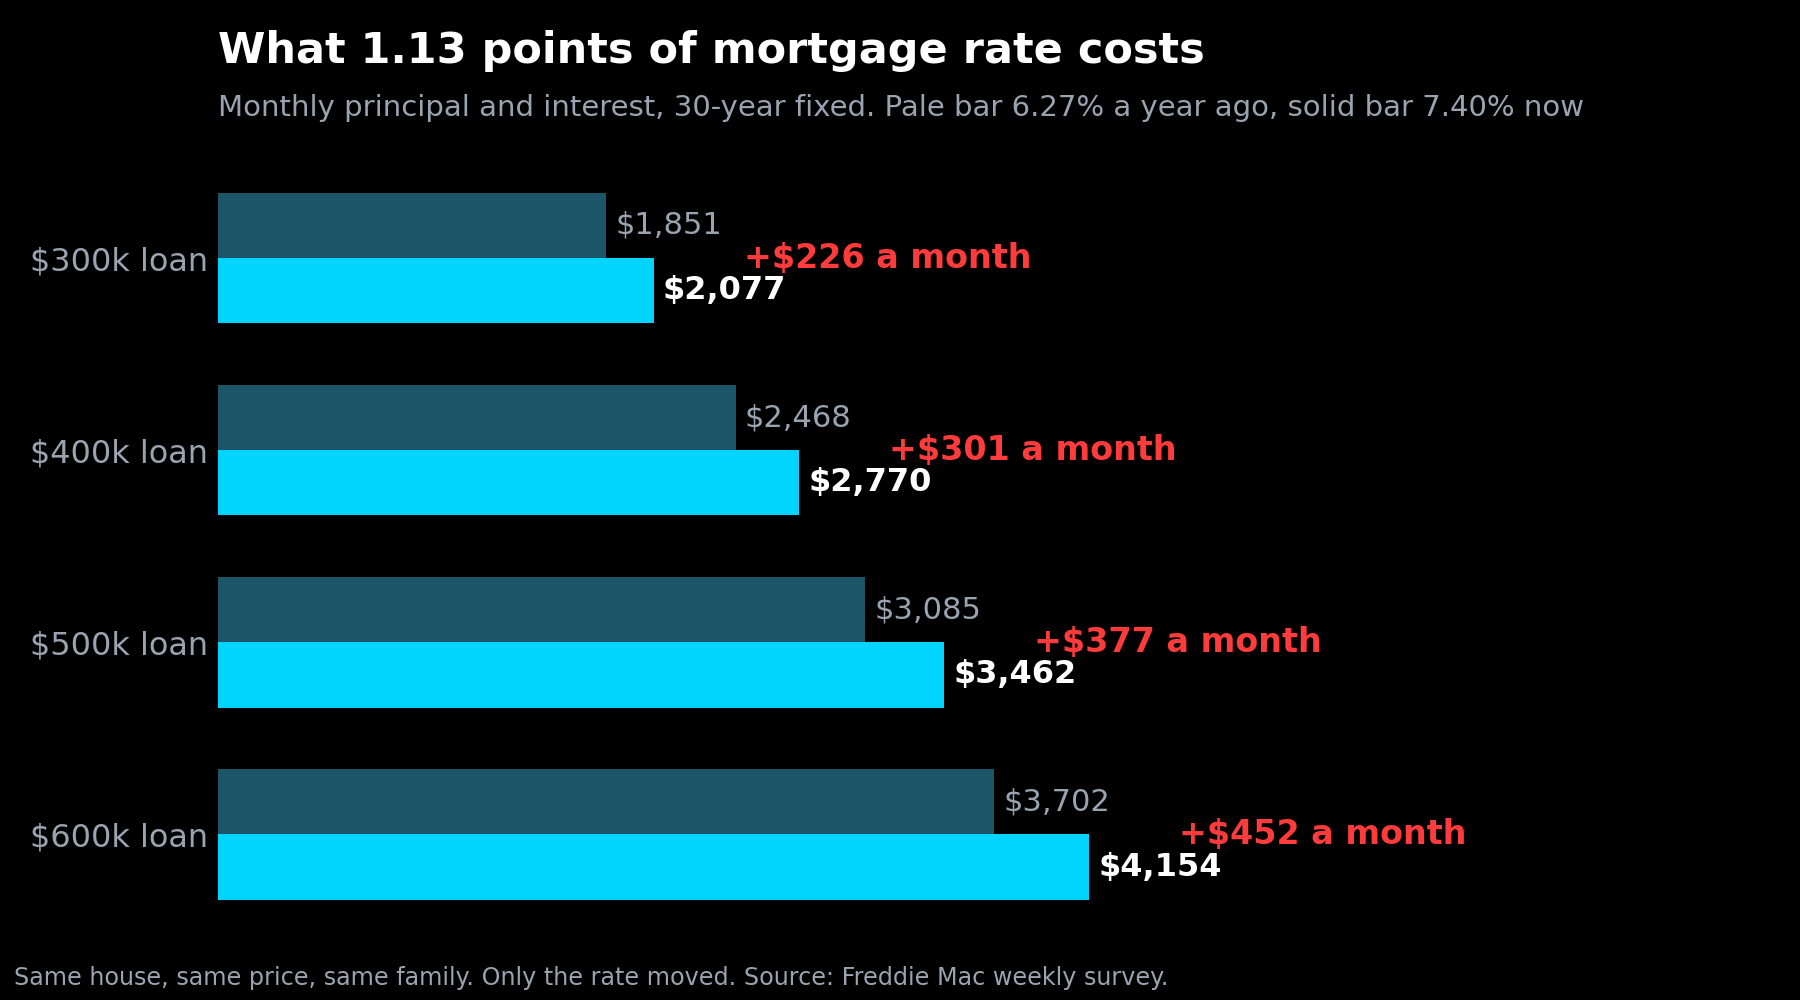
Now look at that buyer traffic number again. An 18 is not mysterious. It is what happens when the people who were going to walk through a model home this month ran the payment, found out it had gone up by the price of a car payment, and stayed home.
What builders are doing about it
This is where the report gets more interesting than the headline, because builders are not sitting still.
43% cut their prices in October. That is the largest share in the period the association reports back to 2020. The average reduction has been 6% for seven consecutive months, which is its own small signal. A number that stable usually means builders have found the size of cut that works and are repeating it, rather than panicking in either direction.
65% are using sales incentives. Paying down the mortgage rate upfront, covering closing costs, upgrades thrown in. That is the nineteenth month in a row at or above 60%. Incentives have stopped being a promotion and become the normal way a new home gets sold.
It is also not evenly spread. On a three-month average, the Northeast sits at 38 and the Midwest at 40, while the South is at 30 and the West at 26. Every region is below the 50 line, but the gap between the Midwest and the West is fourteen points, which is a different housing market, not a different mood.
The association's chief economist described it as housing being squeezed by supply-side constraints and affordability. Both halves of that matter. It is not only that homes are costly. It is that the cost of financing them rose faster than anything else in the chain.
What this does not tell you
It does not tell you what house prices will do. A price cut by a builder on a new home is not the same thing as the resale market repricing, and the two often move apart for a long time. Builders can discount because they have inventory and a cost of carry. An individual homeowner with a 3% mortgage has neither, which is why so few of them list at all. That lock-in is a large part of the supply problem the economist mentioned, and it is not visible anywhere in this survey.
It is also a survey, not a transaction count. It measures what builders say about conditions, not how many homes actually changed hands. Sentiment surveys can overshoot in both directions, and they have before. The useful move is to treat a reading like this as a question to go check, not an answer.
Then there is the thing this cannot see at all. Every number here is a consequence of the mortgage rate, and the mortgage rate rests on expectations that have not settled. The Federal Reserve meets on October 28, and we wrote last week about the argument inside the Fed over whether AI spending is pushing inflation up or is about to push it down. That disagreement, not this survey, is upstream of everything above. It is in the archive if you want it.
One more. A 14-year low sounds like a verdict and it is not. June 2012 was the bottom of a housing collapse that began in 2007, and the comparison is to a level, not to a situation. The index reaching the same number does not mean the same thing is happening. It means builders today are answering three questions about as gloomily as builders did then, for reasons that are not the same reasons.
Homebuilders are a good reminder that the easiest-looking valuation is often the most misleading. They are cyclical, so profits are largest at the top of the cycle and thinnest at the bottom, which means a low earnings multiple can appear exactly when earnings are about to fall. Techdamentals values a company four different ways and shows the full range rather than one number, and when those methods land far apart, the page says so instead of picking the flattering one. On a cyclical, that spread is usually the most honest thing on the page.