Everyone reaching for a comparison this week is reaching for 2023, because that was the last time the Fed raised rates. It's the wrong one. July 2023 was the end of a tightening cycle. Wednesday was the start of one. Those are opposite events that happen to look identical on a chart of the fed funds rate.
Both are worth walking through, because they rhyme with this week in different places.
2023: the last hike
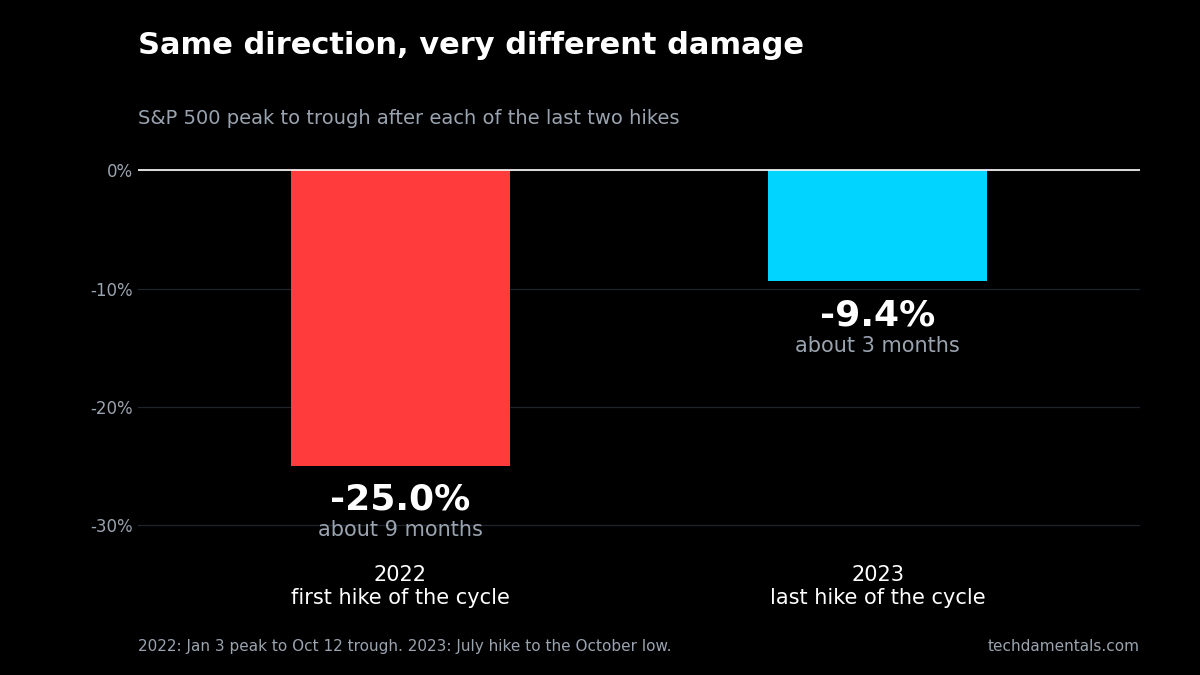
The Fed took rates to 5.25% to 5.50% in July 2023 and then stopped. Stocks fell for about three months, bottoming in late October down 9.4%. The Nasdaq lost 10.8%, the Dow 7.7%.
That's a correction, not a bear market, which needs 20%. Six months later everything had recovered and the index was up 7.1% from the hike. Twelve months later, up 19.5%.
2022: the first hike
Different story entirely. The S&P peaked on January 3, 2022, and the first hike didn't land until March 16. The market fell for ten weeks before the Fed did anything, because it was pricing what was coming rather than what had happened.
By the October low it was down 25%.
Here's the part that matters for you. Almost none of that was earnings. Forward estimates fell about 4% from their mid-2022 peak, and full-year earnings actually grew. What collapsed was the multiple. Investors went from paying 21.7 times forward earnings to 16.6 times, a 25% contraction, while the 10-year yield climbed from 1.5% to nearly 3.9%.
That is the mechanism from our last issue, running across an entire market for ten months. Same money, repriced. And the Nasdaq fell 36% against the S&P's 25%, because more of its value sat in far-off years.
Why 2022 is the right shape and the wrong size
So if 2022 is the better analogy, should you expect 2022?
No, and the reason is dosage.
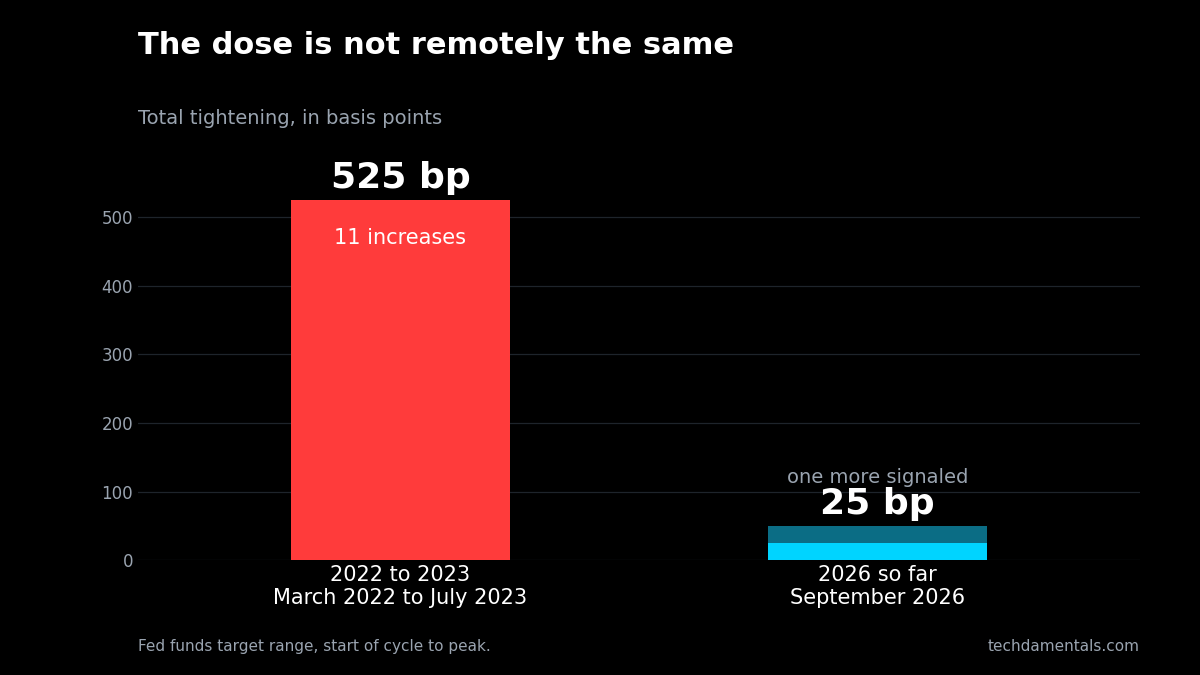
The 2022 cycle went from zero to 5.25% in sixteen months, the fastest since the early 1980s. This one has moved a quarter point, with the dot plot signaling one more this year. The starting point is different too. Stocks entered 2022 at 21.7 times forward earnings. They entered this week at 19.1, already down from 20.4 at the end of June.
The mechanism is real. The dose determines whether you feel it.
What this doesn't tell you
Two episodes is not a sample. Goldman counts seven hiking cycles over recent decades, with the S&P down about 2% on average in the three months after a first increase and up roughly 9% over twelve. Twelve-month returns were positive in every one of those episodes except 2022.
Both of these years had other things going on, too. 2022 had a war in Ukraine, an energy shock and the unwinding of pandemic stimulus. This one has a war in the Middle East and oil above $100. Attributing any of it purely to the Fed is tidier than it is true.
Where all of this lands is that a discount rate is an assumption, and in 2022 the assumption did all the damage while the businesses were fine. Techdamentals shows the inputs behind every number it produces, including that one, so you can see which part of an answer is the company and which part is the weather.