You are going to see this statistic a lot this week.
Since 1950, the American stock market has been higher twelve months after every single midterm election. Nineteen out of nineteen.
That is true. It is also one of the most misleading true things in finance, and the reason is a detail almost nobody includes.
Before 1950, the same pattern failed six times out of nineteen. Stocks were down 33.7% in the year after the 1906 midterms and down 33.3% after 1930.
Same election, same measurement, same index methodology. One half-century has a perfect record. The other half-century does not. Which means the famous streak is not a law of elections. It is a description of the post-war period.
This article is about what the data genuinely shows, what it does not, and which of the things you will hear this week fall apart when you check them. Because two of the most repeated claims about elections and markets do not survive contact with the research, and one of them is repeated by people who should know better.
What the record actually shows
Start with the pattern that holds up best.
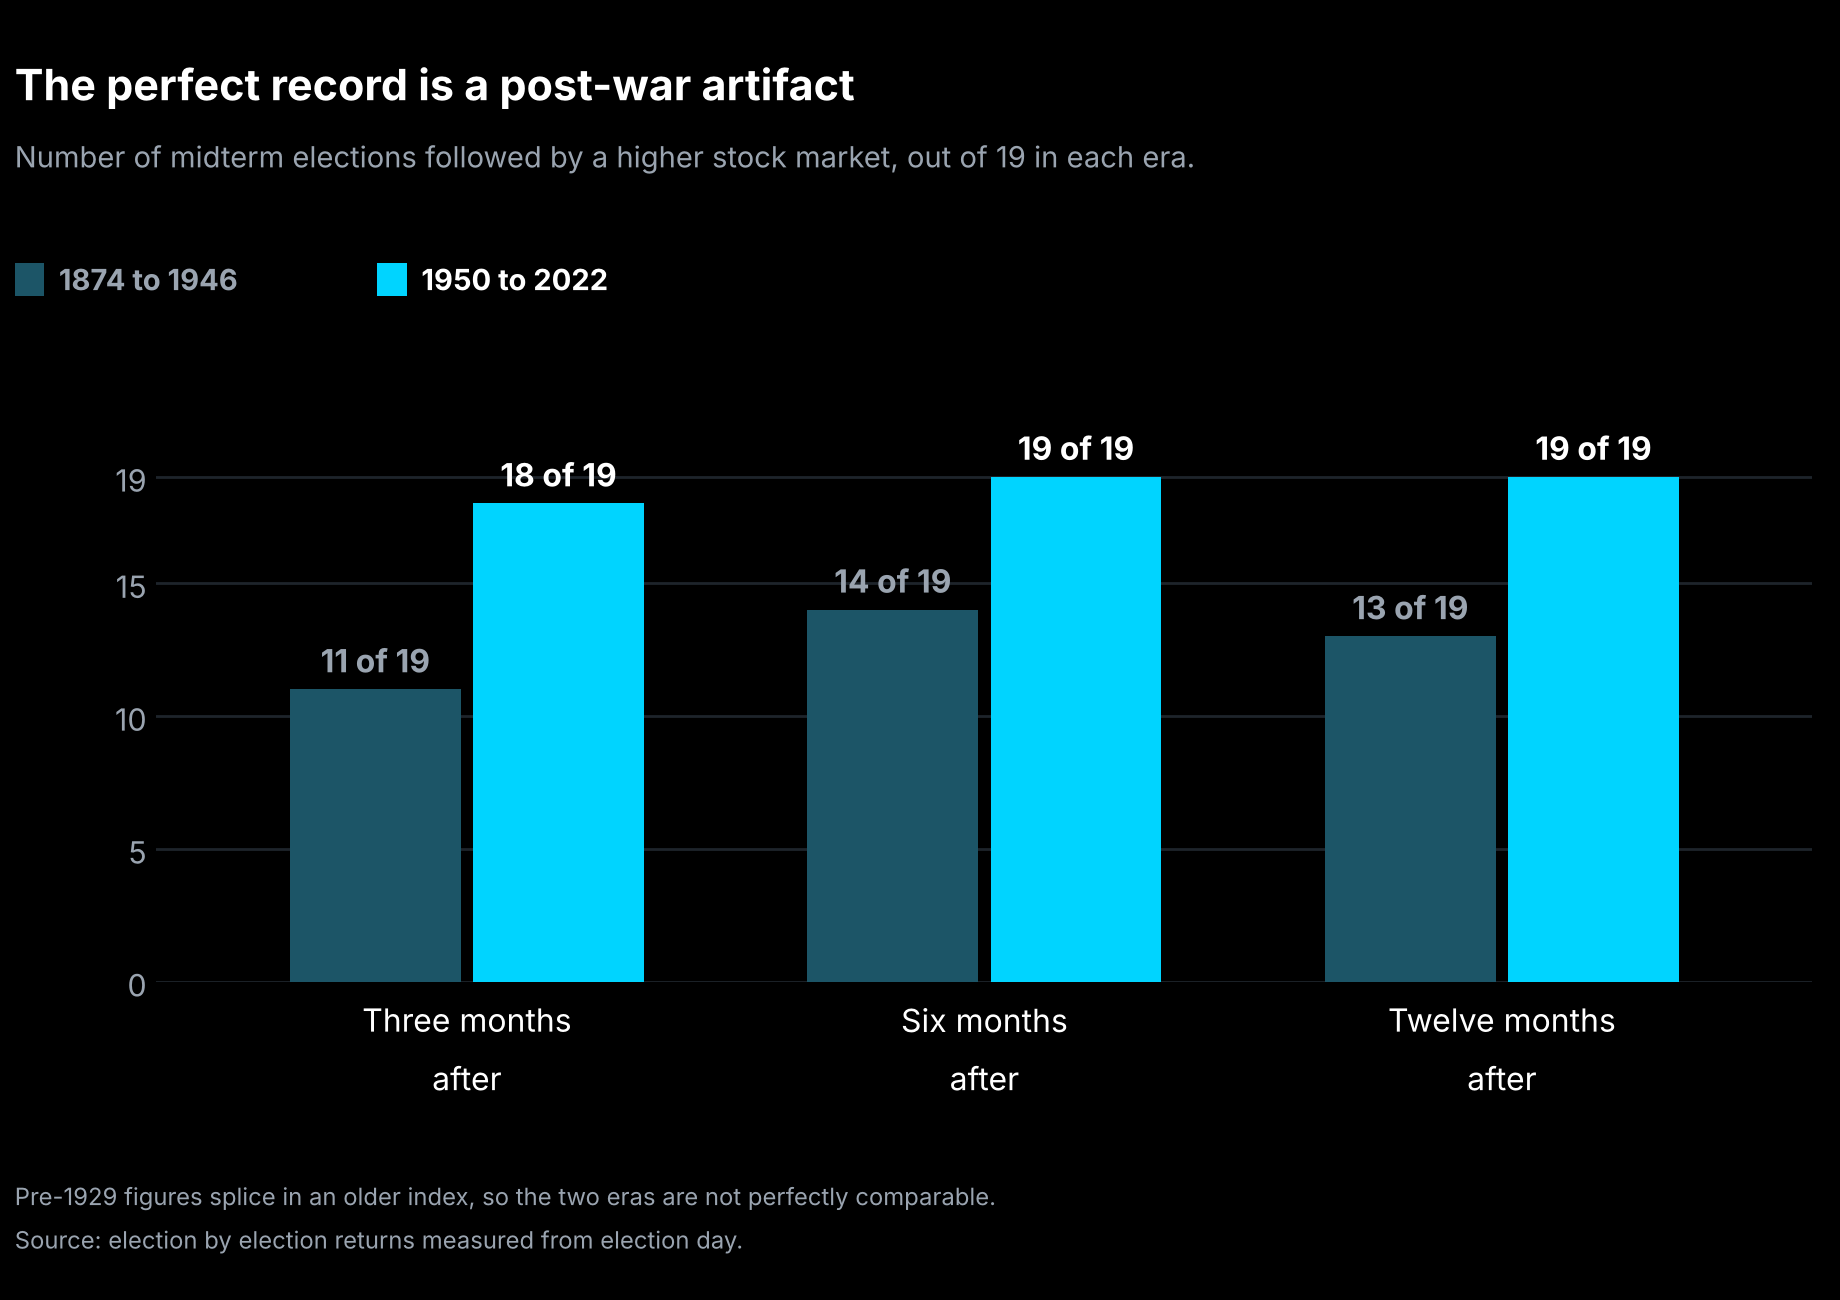
Measuring from election day forward, across the nineteen midterms from 1950 through 2022:
- Three months after: positive 18 times out of 19, averaging 8.1%
- Six months after: positive 19 out of 19, averaging 14.4%
- Twelve months after: positive 19 out of 19, averaging 18.6%
The single negative reading anywhere in that period is the three months after the 2002 midterms, at negative 7.6%. The weakest twelve-month result was 3.0% after 1986. The strongest was 39.9% after 1954.
Now the same measurement on the nineteen midterms from 1874 to 1946:
- Three months after: positive 11 out of 19, averaging 3.1%
- Six months after: positive 14 out of 19, averaging 4.9%
- Twelve months after: positive 13 out of 19, averaging 9.8%
Still positive on average, but with a third of observations going the other way and far smaller gains.
One caution on those older figures. Pre-1929 numbers splice in the Dow, and anything before 1957 predates the S&P 500 in its current form. They are fine for showing an era contrast. They should not be blended into a single average with modern data, which is what several sources do.
And the number you will see quoted for the recent period is not stable either. The commonly cited twelve-month average runs between 14% and 15.4%, while the figure I calculated from the underlying election-by-election table comes out at 18.6%. That gap is measurement convention: election day versus month end, price return versus total return, which index splice. If you see a precise decimal in a headline this week, it was a choice somebody made, not a fact they found.
There is also a weaker pattern on the other side. In the twelve months leading into a midterm, the market has averaged 2.9%, against 8.9% for all years. That is based on 31 cycles going back to 1900.
The calendar problem
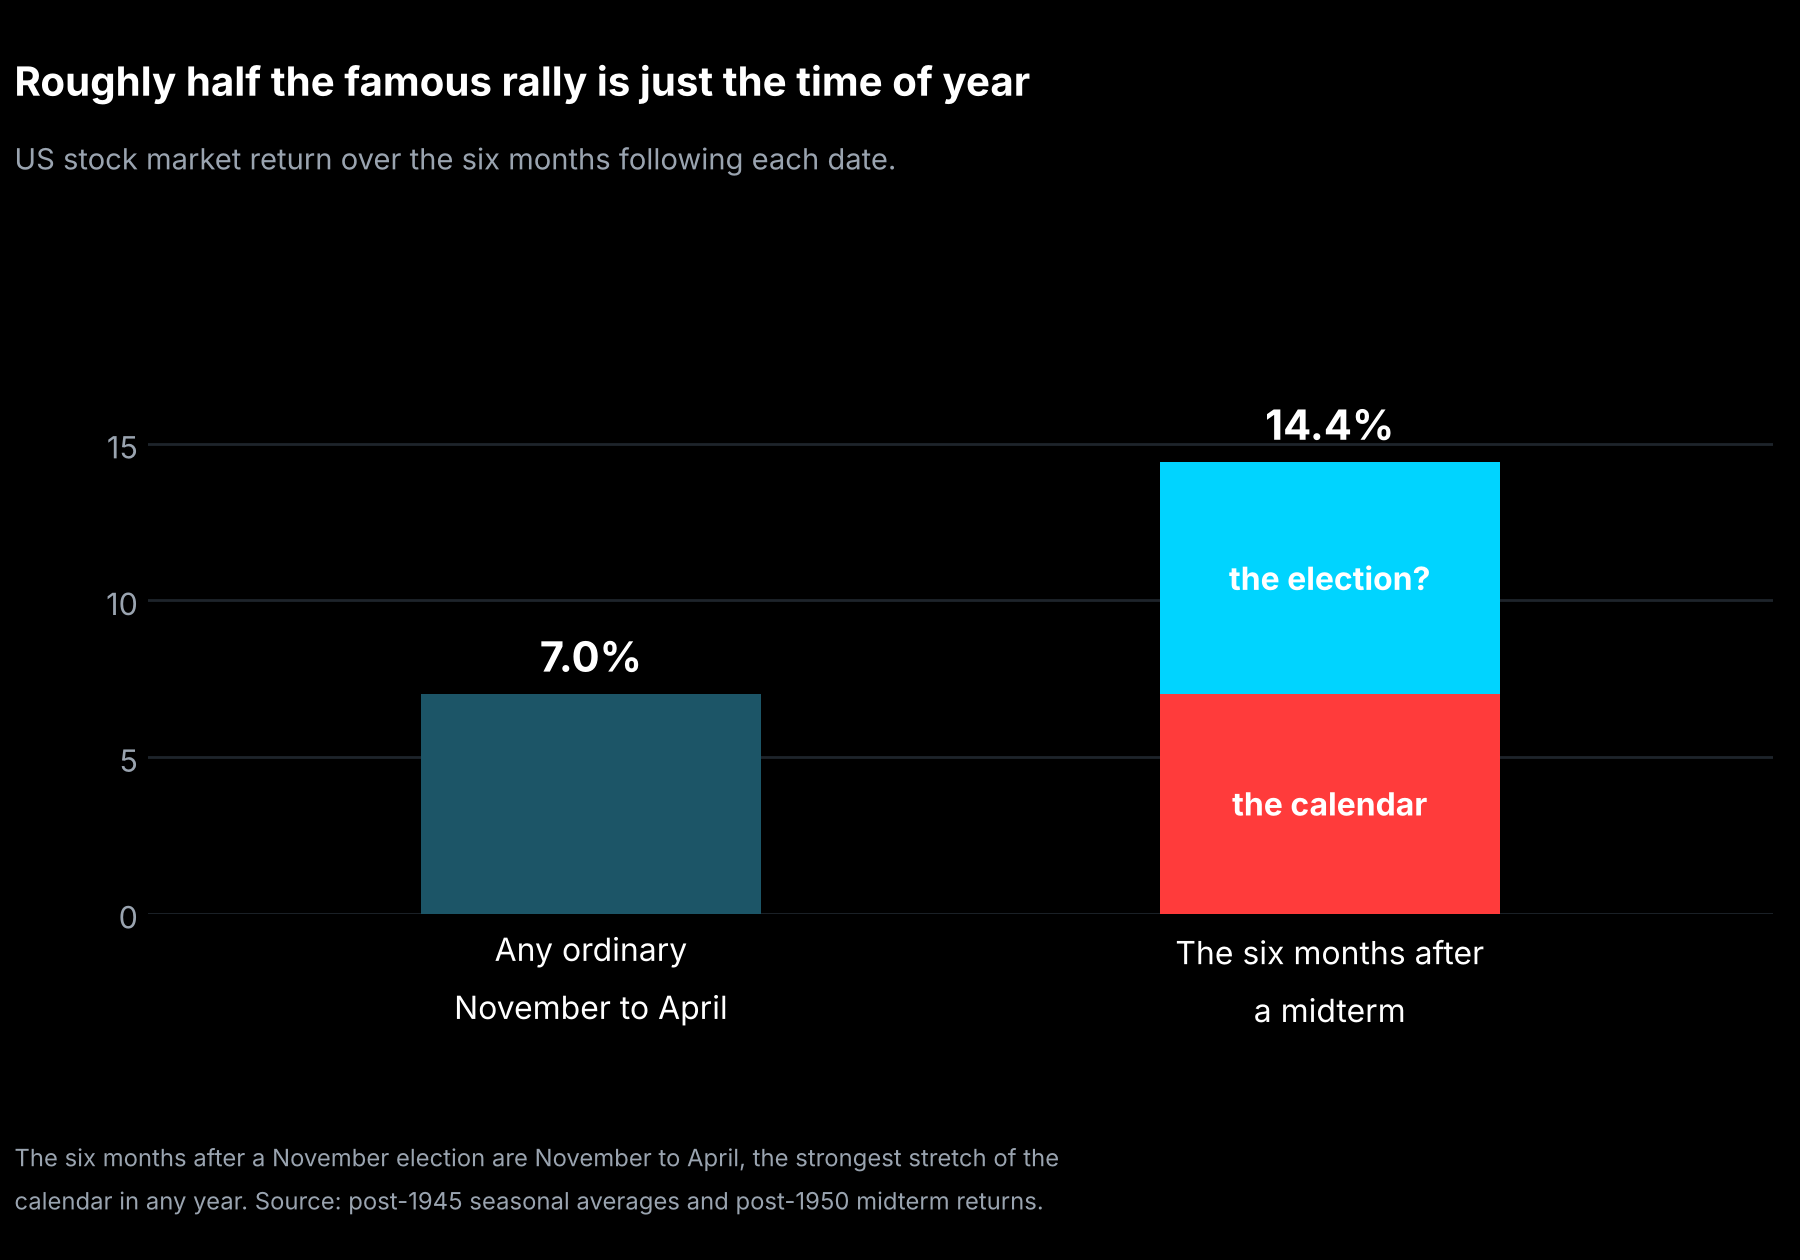
The problem that undoes most of what you will read this week is embarrassingly simple once stated.
The six months after a November election are November through April.
November through April is the strongest six-month stretch in the calendar, every year, regardless of whether there is an election in it. Going back to 1945, the American market has returned roughly 7% over November to April against roughly 2% over May to October.
That is not a quirk of American data. A study covering 109 countries and more than 56,000 monthly observations from 1693 to 2011 found November to April beating May to October by 4.5 percentage points, with the effect present in 82 of the 109 countries, at a level of statistical confidence that leaves no real doubt the pattern exists.
So when somebody tells you the market gained 14.4% in the six months after midterms, the honest question is: compared with what? An ordinary November to April is worth about 7% on its own.
Subtract one from the other and roughly half the famous post-midterm rally is just the time of year.
That leaves perhaps seven percentage points of genuinely midterm-specific effect, and the obvious next question is whether even that survives proper testing.
One study actually tries. It uses a broad market index back to 1926, aligns every year on the same November date, and compares a window around it. Crucially, it uses odd-numbered years as a control group, which removes the seasonality problem, because an odd year has the same calendar and no election.
The findings:
- Midterm windows returned 4.96% against 1.37% for other years
- Against odd years specifically, the gap was 4.18 percentage points, with a probability of about 3% that it arose by chance
- Against presidential election years, the gap was smaller and not statistically meaningful
- Positive in 19 of 25 midterm windows
- And about three quarters of the gain arrived before election day, not after
That last point quietly inverts the popular story. The widely marketed version is that uncertainty resolves and then markets rally. The careful version finds most of the move happening while the uncertainty is still there.
I want to be straight about how much weight this can bear. It is twenty-five observations and one borderline result from one window specification. The author says plainly it is a historical tendency rather than a timing signal. A reasonable person could look at the same evidence and conclude there is nothing there.
The claim that does not survive
You will hear this week that markets prefer divided government, because gridlock means nothing dramatic gets legislated and policy stays predictable.
The best available research finds the opposite.
A peer-reviewed study published in 2006 examined 672 monthly observations from 1949 to 2004. Equity returns were higher under unified government and less volatile. For the smallest companies the gap was enormous, 4.65% annualized under divided government against 27.03% under unified. Equity volatility ran three to four percentage points higher under divided government. For the very largest companies the difference was negligible and statistically meaningless.
A separate analysis published last week, using three-month returns since 1948, found unified control at 2.42% and divided control at 2.17%, with neither difference statistically significant.
Bonds, interestingly, went the other way. Long government bonds returned 5.50% under divided government against negative 1.67% under unified, which is consistent with gridlock meaning slower growth and less spending. That is a real finding and it is the defensible version of the story. It is also not what anyone means when they say markets prefer gridlock.
So where does the popular claim come from? From slicing the data too thin. Once you separate elections by which party controls which chamber, you end up with categories containing three observations, or four, or one. A category with one observation is an anecdote with a decimal point attached. The eye-catching numbers in circulation come almost entirely from those tiny subsamples, and they are the reason this claim refuses to die.
How much can an election actually move a market
There is a clean way to answer this, and some economists worked it out.
The problem with studying elections is that markets price expectations in advance, so by the time a result arrives most of it is already in. The solution is to use betting markets, which update continuously, and measure how stock futures respond at the exact moments those odds shift.
Researchers did this on election night 2006. The result:
- A shift in Senate control was associated with a move of about 0.17% in the American market
- Using the same method on the 2004 presidential election, the presidency was worth about 2.05%
A chamber of Congress changing hands moves the market roughly a tenth to a third as much as the presidency does. Not nothing. Not remotely the event it is treated as.
The same work turned up something useful about speed. On election night 2004, flawed early exit poll numbers leaked and stocks fell about 1% within minutes. When those numbers were discredited, stocks recovered about 1.5%, again within minutes. The repricing was not a next-day story or a next-week story, which is worth remembering when somebody offers to explain Wednesday's market to you on Wednesday.
This week, and what is going to be blamed on the wrong thing
Now the practical part, and it is the most useful thing in this article.
AMD reports Tuesday after the close. That is election night. Options pricing implies a move of 10% to 12%, the largest of any company reporting this week.
Qualcomm and Arm both report Wednesday after the close, while results are still being counted and discussed.
More than a hundred large American companies report this week. Apple reports Monday evening with an implied move of 8% to 9%. The October jobs report lands Friday morning.
So consider what happens if chip stocks fall on Wednesday. Every headline will connect it to the election, because the election is the story that day. The actual cause will have been an earnings call that started at 5pm Tuesday, before most results were known.
This is not hypothetical. It is the week's single most likely error, and you can protect yourself from it with one habit: when something moves, check what that specific company reported before you accept a political explanation.
There is also a structural reason the election matters less than it feels like it should. The ten largest companies now make up roughly 38% of the entire American index, the highest concentration in about sixty years, against under 23% in 2019. A small number of earnings calls can move the index more than almost anything else can. That is arithmetic, not opinion.
And one genuine difference worth flagging. Nearly every midterm in the historical sample happened with the Federal Reserve either cutting rates or heading that way. This one arrives with the Fed having held rates on October 28 while two officials voted for an increase, and with the market pricing meaningful odds of a hike in December. The comfortable post-midterm statistics are drawn overwhelmingly from a falling-rate world, and this is not one.
The backdrop already looks nothing like a political story. October closed with the index down 1.2% on the month and the technology-heavy index down about 5.2%, its weakest month since March 2025. Friday alone took the broad index down 1.82%. Gold fell to a one-year low. The drivers were an artificial intelligence spending scare, a chip company losing more than a quarter of its value in a day, and oil rising on Middle East supply risk.
What this does not tell you
It does not tell you the market goes up after Tuesday. The historical pattern is real, it is substantially seasonal, the remainder rests on a small sample, and roughly a third of the historical cases coincided with an unrelated economic event. One analysis found that removing any single one of three particular years from the record causes the statistical significance of the whole midterm effect to disappear.
It does not tell you volatility rises. The tendency exists in the data, with about a 19% average peak-to-trough decline in the twelve months before a midterm against roughly 14% in a typical year, but those are different measurement periods and nobody has tested it properly. This year has been unusually calm by that measure, with four days of 2% moves through August against 46 in 2022. One bank noted in September that the extra volatility premium people pay ahead of elections had already halved before the event arrived.
It does not tell you which sectors move. Dispersion between the best and worst sectors runs modestly wider in midterm years, about 11.3% against 8.5%, which tells you things spread out rather than which direction anything goes. The same research shows energy finishing as both the worst sector and among the best across different administrations, and technology finishing in the top two across the last four regardless of who held power.
It does not tell you anything about who will win, and this article deliberately contains nothing about that. Not because it is unknowable, but because the research above says the market impact of a chamber changing hands is about a tenth of a presidential election, and gets priced within minutes of being known.
And it does not tell you to do anything. Nineteen observations cannot distinguish a real five percent effect from random noise. If the pattern were strong enough to act on, it would have been competed away long before you read about it in a week when every financial publication is running the same chart.
What the evidence supports is narrower and more useful than a forecast. Elections are a smaller input to markets than the coverage implies, the famous statistics about them are half calendar effect and half small sample, and this particular week has more than a hundred earnings reports and a jobs number in it that will matter more to prices than the vote will.
That is why we show the workings instead of a conclusion. Techdamentals runs four separate valuation methods and displays the full range, because one number tells you where somebody landed and nothing about what it rests on.