Amazon reported after the close on Thursday. Free cash flow over the past twelve months was an outflow of $42.4 billion.
A year earlier the same measure was a positive $14.8 billion. That is a swing of $57 billion in twelve months, and it is the largest cash reversal any of the big technology builders has posted in this cycle.
The shares closed the regular session down 4.25% at $243.79 and fell further after the release. How much further is genuinely unclear: reports that evening ranged from about 5% to more than 9%, and one outlet claimed 12.5%. After-hours trading is thin and the figures do not reconcile, so treat any single number you see with suspicion.
So: is that bad?
The honest answer is that you cannot tell from the number, and anyone who tells you otherwise is guessing. A company can burn $42 billion and be perfectly healthy. A company can burn $42 billion and be in serious trouble. The number is identical in both cases. What separates them is a specific test, and Amazon's own chief executive has already told you what the answer is supposed to be and roughly when you will be able to check it.
That is unusual, and it is worth walking through properly.
We wrote on Thursday about why the faster-growing company fell and the slower one did not. This is the same question with a much larger number attached.
First, do not compare this to Alphabet's figure
Almost every account of this is going to put Amazon's $42.4 billion beside Alphabet's $9.1 billion and conclude that Amazon is four and a half times worse. That comparison is wrong, and it is wrong in a way that is easy to avoid once you have seen it.
Alphabet's $9.1 billion was one quarter. Amazon's $42.4 billion is twelve months.
Companies choose which window to report on. Alphabet reports free cash flow for the quarter and also for the trailing year. Amazon leads with the trailing year. Neither is hiding anything, but the two numbers measure different lengths of time and putting them side by side makes one look four times the other when the periods are not the same.
Run both on the same basis and the picture changes completely. Over the past twelve months:
- Amazon: an outflow of $42.4 billion
- Alphabet: an inflow of $19.7 billion
On a full-year view Alphabet is still positive. Amazon is deeply negative. That is a real and large difference, and it is a different statement from the one the headlines are making.
The habit worth taking from this: whenever you see a cash flow figure, find out how long a period it covers before you compare it to anything. Quarterly and annual numbers get quoted interchangeably and they are not interchangeable.
The business is generating more cash than it ever has
Here is the fact that makes the headline misleading on its own.
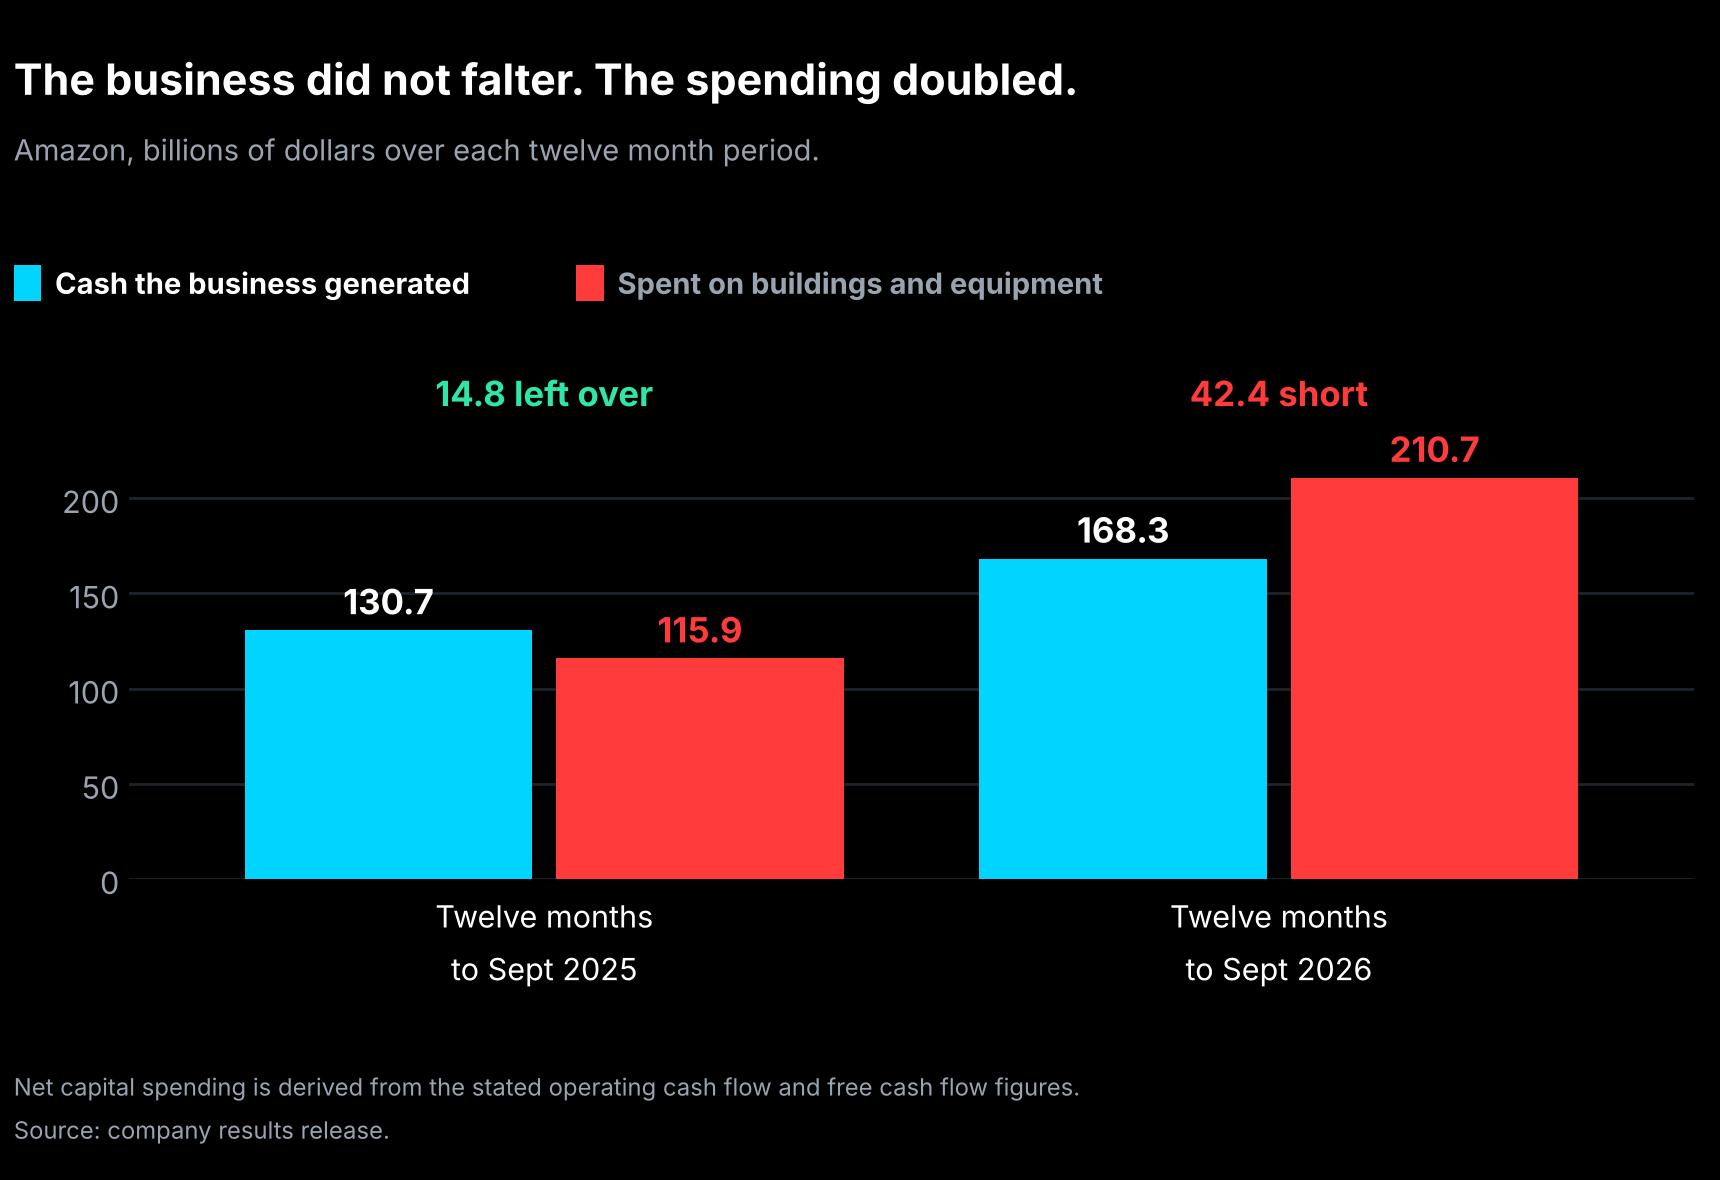
Amazon's operating cash flow over the past twelve months was $168.3 billion, up 29% from a year earlier. That is the money the business actually produced from moving goods and renting computing. It did not fall. It did not stall. It grew at nearly thirty percent and reached the highest level in the company's history.
So where did $42 billion go?
Into buildings and equipment. Amazon's purchases of property and equipment over the same twelve months came to $215.2 billion, against $120.1 billion the year before. The company itself identifies the cause in one line: the swing was "driven primarily by a year-over-year increase of $94.8 billion in purchases of property and equipment."
That is the whole story. Not a collapse in the business. An increase in the spending, of ninety-five billion dollars, in a single year.
Put the two together and Amazon spent roughly 125% of the cash its operations produced. It generated $168 billion and committed well over $200 billion. The gap is the $42.4 billion.
One honest limit on the framing, and it applies to every article you will read about this. Amazon's capital spending is not all data centers. The same line covers warehouses, sorting facilities, delivery vans, cargo aircraft, grocery stores and the robotics inside the fulfillment network. Alphabet's spending is overwhelmingly computing infrastructure. Amazon's is computing infrastructure plus the largest private logistics operation in the world, and the company does not publish a split between them.
So when you see this called $215 billion of AI spending, that is an assumption rather than a disclosure. A large and growing share clearly is going into AWS capacity, because that is what management keeps describing and it is where the growth is. But nobody outside the company can tell you how much, and if anyone quotes you a precise percentage, ask where they got it.
This is the same mechanism we walked through on Thursday, at a larger scale. Money spent on something that lasts leaves immediately and in full. The expense arrives slowly, as depreciation, over the years the asset is used. So in the year you build, cash looks terrible and profit looks fine.
And Amazon's profit looks more than fine. Operating income was $28.1 billion for the quarter, up from $17.4 billion, a rise of about 61%. That is above the top end of Amazon's own guidance range of $22.5 billion to $26.5 billion, and at 13.9% of sales it is the highest operating margin the company has ever reported.
So here is the sentence that describes the quarter properly, and almost nobody will write it this way: Amazon missed Wall Street's forecasts while beating its own. Revenue of $201.9 billion came in just under the roughly $202.1 billion analysts expected, and earnings of $1.89 a share came in under the $1.96 expected. Both are misses. Both are also against numbers analysts invented, not numbers the company published. Against what Amazon itself told investors to expect three months ago, the profit was better than promised.
The profit figure that looks worse than it is
One wrinkle, because it will confuse people and it is the exact reverse of something we covered on Thursday.
Amazon's net income fell, to $20.7 billion from $21.2 billion, and earnings per share fell to $1.89 from $1.95. On the face of it, profit went backwards while operating income rose 61%. Those cannot both be ordinary.
They are not. The prior-year quarter included $9.5 billion of pre-tax gains on Amazon's investment in an artificial intelligence company. That was a paper gain. No cash came in. This year there is no equivalent, so the comparison is against an inflated base.
Readers of Thursday's issue will recognize the shape, because Alphabet had the same thing happen with the sign reversed: its reported profit fell largely because of an $8.2 billion non-cash investment loss. Alphabet's profit was dragged down by a paper loss this year. Amazon's was flattered by a paper gain last year.
Same mechanism, opposite direction, and in both cases the number has nothing to do with how the business performed or how much cash moved. When a company holds stakes in other companies, those stakes get marked up and down every quarter, and the marks run straight through reported profit without anybody trading a single share.
Why Amazon can afford this at all
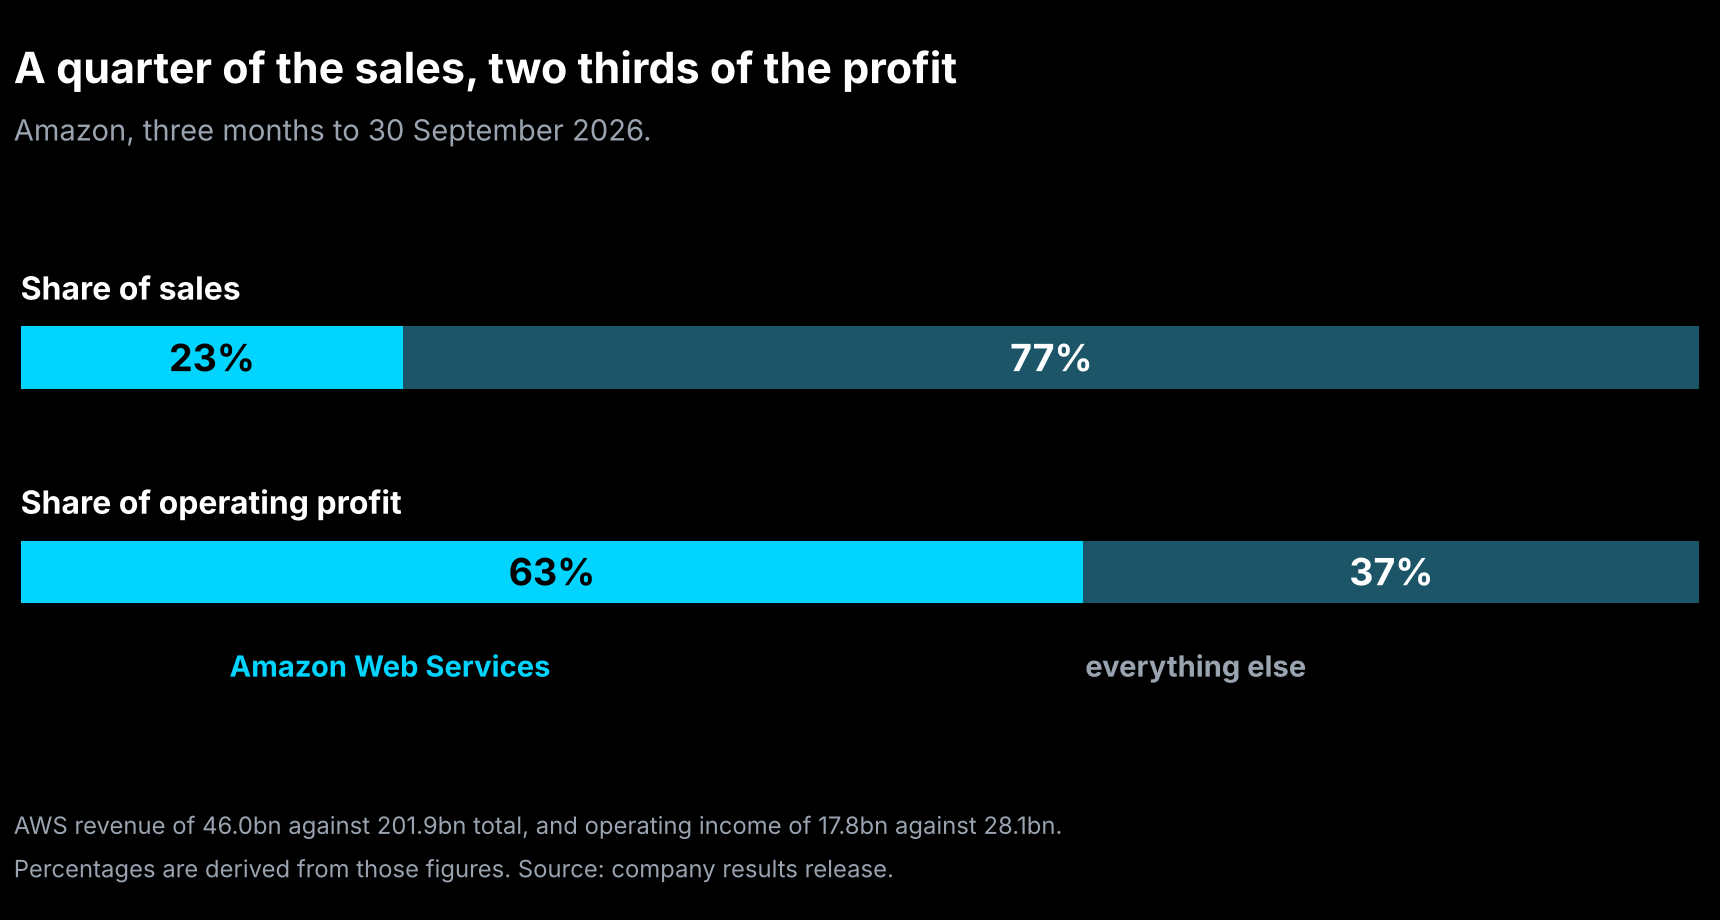
Look at where the profit comes from and the spending starts to make more sense.
Amazon Web Services produced $46.0 billion of revenue in the quarter, growing 39%. That is about 23% of Amazon's total sales.
It produced $17.8 billion of operating income, out of $28.1 billion for the entire company. That is roughly 63% of all the profit.
So not quite a quarter of the sales generates nearly two thirds of the profit. The North America retail business, which is most of what customers think of as Amazon, contributed $8.7 billion, and the international business $1.6 billion.
That concentration is the argument for the spending. The part of Amazon that is growing at 39% and carries by far the best margins is also the part that requires data centers. If you believe the demand is there, spending the retail business's cash on computing capacity is not reckless. It is moving money toward the thing that earns most.
Growth also accelerated. AWS grew 39% this quarter against 37% in the prior one. Cloud businesses that are capacity-constrained grow faster when capacity arrives, which is at least consistent with what management has been saying.
The test, and the date attached to it
Here is what makes this story unusually checkable.
Andy Jassy has said, on the record, what the negative cash is for and when it reverses: "We'll spend a lot of capex and encounter free cash flow headwinds until these data centers come online."
That is a claim with a mechanism and a timeline, not a slogan. Translated: the cash goes out now, the capacity is under construction, and once it is operating and rented out, the cash comes back. He repeated the logic this week, saying the investment "is working, with over 39% year-over-year revenue growth in Q3."
So you now have a test you can run yourself over the next several quarters, and it has three parts.
Does AWS revenue keep accelerating as capacity comes online? If the buildings are filling, this is where it shows. If growth flattens while spending continues, the capacity is arriving faster than the demand.
Does the gap between operating cash flow and spending narrow? Right now Amazon is spending about 125% of the cash it generates. If the thesis is right, that ratio falls as the building slows and the earning starts. If spending keeps rising faster than cash generation, the thesis is in trouble.
Does AWS hold its margin? It is running near 39% operating margin. New capacity brings new depreciation, and depreciation is a real charge against profit for years after the cash has gone. If margin erodes meaningfully as the new assets start depreciating, the returns are not what was promised.
None of those is a prediction. They are three things you can look up every quarter. That is a far better position than most stories leave you in.
And here is the lever to keep an eye on while you do. Depreciation depends on an assumption: how many years the company expects an asset to remain useful. Stretch that assumption and each year's charge gets smaller, reported profit gets larger, and not a single dollar of cash moves. It is a legitimate accounting judgment and it is also a dial.
Jassy described turning it, on the call, in plain language. Asked about how quickly the spending pays back, he said Amazon is "finding ways to extend useful lives and to make the break even sooner," and that on payback timing "we're continuing to move that left. We're continuing to make that shorter."
Read that carefully. Part of making the payback shorter is operational, filling the buildings faster. Part of it is deciding the buildings last longer. Both improve the reported numbers. Only one of them changes anything physical.
Amazon held its 2026 capital spending at about $220 billion, unchanged. For scale, Alphabet guided $195 billion to $205 billion for the same year.
And then it declined to answer the question everyone was waiting for. Every preview of this report said the same thing: the figure that would move the stock was 2027 capital spending. Amazon gave no number. What Jassy said was that the company expects to spend "meaningfully more in 2027 with a clear line of sight to attractive financial returns," and stopped there.
That absence is more informative than an estimate would have been. Alphabet did the same thing a day earlier, saying spending would rise significantly in 2027 and deferring the figure. Two of the largest builders in the world, reporting within twenty-four hours of each other, both declined to say how much they will spend next year. If you see a 2027 number for either, somebody on Wall Street made it up.
There is a fourth thing to watch, and it arrives sooner than the other three. Amazon guided the current quarter to $240.0 billion to $247.0 billion of revenue, growth of 12% to 16%, and operating income of $28.5 billion to $33.5 billion against $25.0 billion a year ago.
Against last year, that is a healthy raise. Against what analysts expected, both midpoints came in light on revenue and on profit. Those two readings are not in conflict and most coverage will only give you one of them. The honest version is that Amazon guided up and guided below, at the same time, and the gap between those two statements is simply the distance between the company's plan and the Street's hopes.
Watch this line next quarter more than any other. If a later quarter guides operating profit down while the spending continues, that is the first real crack in the argument, and it shows up here before anywhere else.
What this does not tell you
It does not tell you Amazon is running out of money. Operating cash flow of $168 billion, up 29%, is not the profile of a company in difficulty. Negative free cash flow here is a choice about where to put the money, not an inability to cover the bills. Those two situations produce the same headline figure and are nothing alike.
It does not tell you the spending will pay off. That is the entire open question and nobody can answer it yet. The capacity is partly unbuilt. The customers for it are partly hypothetical. Management's position is that returns will justify it, and management is not a neutral party on that question.
It does not tell you the quarterly figure. Amazon leads with the trailing twelve months. Comparing that to another company's single quarter, which is what most coverage will do this weekend, overstates the difference by a wide margin.
It does not tell you profit got worse. Operating income rose about 61%. The decline in net income is almost entirely the absence of last year's paper investment gain, and paper gains are not performance in either direction.
It does not tell you the after-hours drop was about cash flow. The release also carried light guidance on both lines and misses against analyst forecasts, and Thursday was a day when an entire sector sold off before Amazon reported anything. One portfolio manager did put it squarely on the cash: "Operations generated plenty of cash but their capex just absolutely swallowed it." That is one named view, not a settled explanation.
And it does not tell you the people paid to ask questions were worried about it. On the earnings call, with a $42.4 billion cash outflow in the release, no analyst asked about free cash flow. The questions were about capacity, payback periods and how long the servers last. Make of that what you will, but it is worth knowing that the number dominating the headlines went entirely unexamined by the professionals who had the company on the line.
And it does not tell you depreciation is handled. This is the part almost nobody writes about. Every dollar of that $215 billion becomes a charge against profit over the coming years. The cash pain arrives first and all at once. The profit pain arrives afterwards, slowly, and lasts far longer. A company can get through the cash phase comfortably and still find the depreciation phase uncomfortable.
What this week actually offers is a clean lesson in why a single number cannot carry a verdict. The same $42.4 billion means "building hard into demand that exists" or "spending into a wall," and the figure itself is silent on which. The only way to tell is to find the claim being made, work out what would prove it right or wrong, and then check.
That is why we show the workings rather than one figure. Techdamentals runs four separate valuation methods and shows the full range, because a number on its own tells you where somebody landed and nothing about whether they should have.