On Saturday, November 14, 2026, bitcoin traded near 63,500 dollars and touched about 62,000 overnight, according to price trackers. A week earlier, on Saturday, November 7, 2026, it was near 75,750. That is a fall of roughly 14% to 16%, depending on which price and which hour you start from.
By the afternoon of November 14 the explanations were everywhere. Inflation came in hot. Bets on a Federal Reserve rate hike rose. The 10-year Treasury yield hit 5.15%. The dollar strengthened. Funds that hold bitcoin lost money for the seventh day in a row. Every one of those things happened. The question this issue tries to answer is the one headlines skip: which of them, if any, can the data actually connect to bitcoin's fall?
The honest answer is that no one can say, and this issue will not say it either. What we can do is lay out how each explanation is supposed to work, check it against dates and sizes, and show where it holds up and where it does not. We name the sources of each figure. We say plainly where a number comes from only one outlet, where trackers disagree, and where we could not verify something. None of this is a view on where bitcoin goes next.
One housekeeping note. Several price figures below come from outlets that quote different exchanges at different hours, so they differ by a few hundred dollars. Where a figure is rounded, we say so.
What happened to the price
Here is the path, as reported by the outlets we could verify.
On Friday, November 6, 2026, bitcoin held around 75,850. Over the weekend it slipped below its 50-week average, a long-run trend line, and by the morning of Monday, November 9, 2026 it was under 74,000. On Thursday, November 12, 2026 it closed near 71,350. On Friday, November 13, 2026 it fell as low as 67,555 on Coinbase, its weakest since mid-August. On Saturday, November 14, 2026 it traded around 66,700 in the morning, about 65,200 in the late morning Eastern, and about 63,500 by the evening. Two outlets say it briefly touched about 62,000 overnight into November 15.
A reader sent us a screenshot from a trading platform showing 61,970 as the session low. That figure is real for the contract it came from, which is the bitcoin futures contract traded on the CME Group exchange. Futures are a separate market from the spot price, and the two can differ by a small gap. We could not find a spot-price source that prints 61,970, so we say "about 62,000" for spot and name the futures contract when we use the other number.
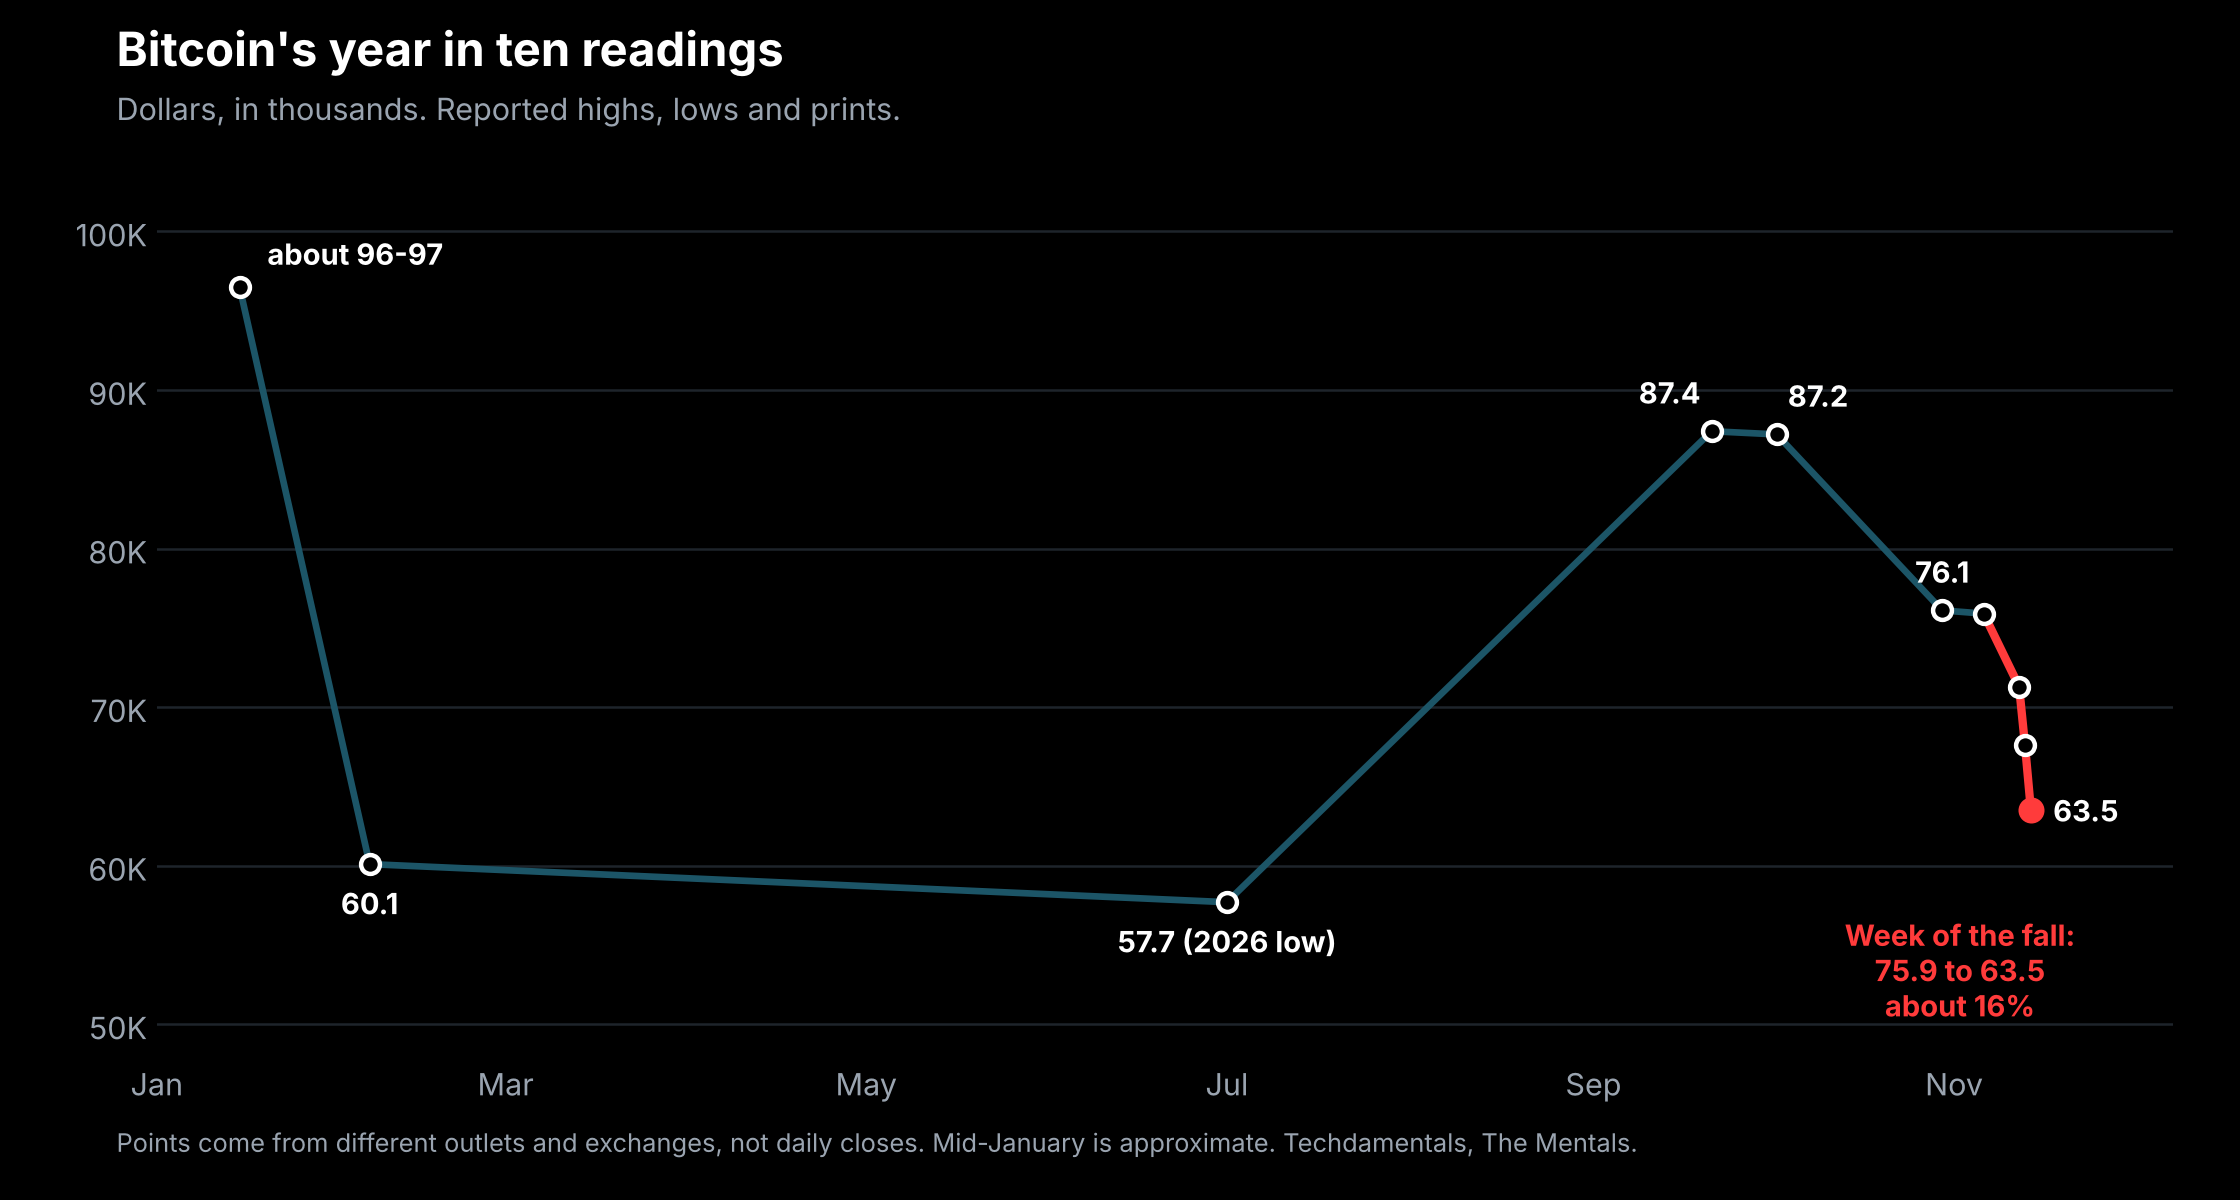
To put the fall in context, bitcoin is about 27% below its September high of 87,397 on Coinbase, about 34% below the mid-January high of roughly 96,000 to 97,000 (the exact peak we could not confirm), and about 50% below its all-time high of about 126,000 from Monday, October 6, 2025. It is above the 2026 low of about 57,700, reached on Wednesday, July 1, 2026. So this is a retest of the lower half of this year's range, not a break to a new low.
One of the figures you may have seen needs a correction. An article described the drawdown as "24% from October's high." October's high was 87,249 on Friday, October 2, 2026, which would put 24% at about 66,300, roughly where bitcoin traded at midday on November 14. By that evening the figure had gone stale.
Here is a fact that matters for everything that follows. While bitcoin fell about 16%, US stocks rose. The S&P 500 gained 2.5% over the week ended Friday, November 13, 2026, and the Nasdaq Composite gained 2.3%, according to the Associated Press. It was the first up week for stocks since early October. Whatever hit bitcoin this week, it was not a market-wide panic.
Three tests for any "it fell because" story
Before we go through the explanations, here is the method, because you can use it on any headline.
Timing. Did the cause come before the drop? A drop that started before a piece of news cannot be fully explained by it.
Size. Is the cause big enough to account for the move? A small surprise in one number rarely explains a double-digit weekly fall by itself.
A counter-example. Is there a time when the same cause was present and the price did not fall? If so, the cause alone is not enough.
None of the three tests can prove a cause. Passing all three would still only make a story plausible. But failing one is a good reason to hold the story loosely.
Explanation one: hot inflation and rate-hike bets
The story. On Tuesday, November 10, 2026, the Bureau of Labor Statistics reported that the consumer price index rose 0.4% in October, against 0.3% expected. Core prices, which leave out food and energy, rose 0.3%, against 0.2% expected. Bets that the Federal Reserve will raise rates at its December 8 and 9, 2026 meeting rose.
For context on the Fed: it raised its target range by a quarter point on Wednesday, September 16, 2026, to 3.75% to 4.00%, and held there on Wednesday, October 28, 2026, on a 10 to 2 vote, with both dissenters preferring another hike. So a hike next month is not a surprise to anyone who has been following. By the CME Group's FedWatch tool, as reported by several outlets, odds of a December quarter-point hike were above 80% before the inflation report and about 85% to 88% after it. Odds of a half-point hike were about 11% to 15%. One outlet says odds of a January hike moved from about 10% to "largely priced," and that is a single source.
The mechanism. Bitcoin pays no interest and produces no earnings. When safe assets such as Treasury bills pay more, the case for holding something that pays nothing gets harder, and investors tend to reduce risk. That is the standard argument, and it is not silly.
What the data show for it. The 2-year Treasury yield, which is the part of the curve most sensitive to Fed expectations, rose from 4.56% on Monday, November 9, 2026 to 4.88% on Friday, November 13, 2026, according to Treasury's daily table. A 2023 International Monetary Fund working paper (Che and co-authors) found that Fed tightening lowers a common factor that explains about 80% of crypto price variation, which it links to investors' willingness to take risk.
What cuts against it. Four things.
First, timing. Bitcoin was already below 74,000 on Monday, November 9, 2026, a day before the inflation report. The sharpest leg came on Thursday, November 12, 2026 through Saturday, November 14, 2026, two to four days after it.
Second, size. The inflation surprise was one tenth of a percentage point on both headline and core. A one-tenth surprise is the kind of difference economists argue about. It is hard to see how it explains a move of 14% to 16%, though the market can react to what a number implies, not only its size.
Third, the research is mixed. A 2023 New York Fed staff report (Benigno and Rosa) found bitcoin largely unresponsive to most macroeconomic news, and a weak, unstable response to inflation surprises. The IMF paper and the New York Fed paper do not agree, and they use different periods and methods.
Fourth, there is a counter-example in this very week. Stocks, which should be at least as sensitive to rate-hike odds, rose 2.5%.
Our reading, which is an opinion and not a finding: hike odds are a plausible part of the backdrop, but the data we have do not show them as the main reason.
A number with the wrong label
One figure that circulated alongside the inflation story deserves its own section, because it shows how a headline can be wrong about a fact that sounds simple.
An article on November 14 said bitcoin was pressured by "November payrolls of 165,000," against about 65,000 expected. The November jobs report cannot exist yet. It is due in early December.
The 165,000 figure is real. It is the October jobs report, which the Bureau of Labor Statistics released on Friday, November 6, 2026. Payrolls rose by 165,000 against about 65,000 expected, according to news reports of the release. The unemployment rate was 4.1%, against 4.2% expected. Average hourly earnings rose 0.4% on the month and 3.1% over twelve months. Earlier months were revised up: August by 53,000 to 186,000 and September by 31,000 to 60,000. We could not open the bureau's own site, so the release date and figures come from news reports that agree with each other.
Why does the label matter? Because it changes the timing test. A report released on Friday, November 6, 2026 came a full week before the sharpest part of the fall. On that day bitcoin fell about 1.1%, the 10-year yield moved from 4.84% to 4.86%, and the 2-year from 4.46% to 4.51%. That is a small reaction, and it was already part of the story before the inflation report arrived. Labeled "November," it sounds like fresh news driving a weekend slide. Labeled correctly, it is a week-old number.
We do not know where the wrong label came from. One guess, and it is only a guess, is a mix-up with the delayed reports from late 2025. We found one outlet repeating the figure without a month and several labeling it October.
The habit worth keeping: when a headline attaches a number to a market move, find the date of the number.
Explanation two: the 10-year yield at 5.15%
The story. The 10-year Treasury yield, the benchmark for borrowing costs across the economy, rose from 4.84% on Thursday, November 5, 2026 to 5.15% on Friday, November 13, 2026. Treasury's daily table shows 4.88% on Monday, November 9, 2026, 4.98% on Tuesday, November 10, 2026, and 5.10% on Thursday, November 12, 2026. There is no entry for Wednesday, November 11, 2026, because the bond market was closed for Veterans Day.
The mechanism is related to the first one. A higher yield means a safe asset pays more, which competes with riskier ones.
What the data show for it. Bitcoin fell about 16% while the yield rose 31 basis points, and a basis point is one hundredth of a percentage point. The two moved in opposite directions over the week.
What cuts against it. The 10-year was already at 5.10% on Thursday, October 15, 2026 and 5.15% on Monday, October 19, 2026, according to Treasury's table. Bitcoin was above 80,000 in October. So the same yield level coexisted with a much higher bitcoin price three weeks earlier.
There is also a stretch where the yield and bitcoin moved the wrong way for the story. From Friday, October 30, 2026 to Thursday, November 5, 2026 the 10-year fell from 4.94% to 4.84%, and bitcoin still slipped from about 77,400 to about 75,900.
One caution on the other half of the story. Economists often focus on the real yield, which is the yield after subtracting expected inflation. Treasury's long-term real average series fell from 3.37% on Monday, October 5, 2026 to 3.04% on Thursday, November 5, 2026, which would be favorable to bitcoin in the usual story, while bitcoin fell 7.3% in October. We could not get the real yield for the week itself, and we found no research on bitcoin and real yields we could verify, so we leave that test open.
Our reading: the timing of the yield's rise lines up with the fall this week, but the same yield did not stop bitcoin from trading far higher in October.
Explanation three: the stronger dollar
The story. One outlet said the US dollar index, which measures the dollar against a basket of major currencies, rose above 103, its highest since April 2025. A stronger dollar tends to tighten financial conditions around the world and pull on assets priced in dollars.
What we can verify. Very little about the specific level. The 103 figure and the "highest since April 2025" claim come from one outlet, and we could not open the other pages that carry the "19-month high" wording, so we do not use it.
What cuts against it. The dollar was already at multi-month highs earlier. A currency news report on Monday, October 12, 2026 described the dollar as holding an 18-month high, and a report on Friday, October 2, 2026 put the index above 102.20. Bitcoin was far higher then. We also found no research on bitcoin and the dollar that we could verify.
Our reading: this is an explanation that outlets assert, with a single source for the level and a timing problem. We would hold it the loosest of the five.
Explanation four: money leaving bitcoin funds
The story. Exchange-traded funds that hold bitcoin directly, often called spot bitcoin funds, had net outflows of about 1.07 billion dollars from Monday, November 9, 2026 through Friday, November 13, 2026, according to Farside Investors data as reported by a secondary outlet. SoSoValue's daily figures sum to about 1.065 billion. The prior week, Monday, November 2, 2026 through Friday, November 6, 2026, was worse, with about 1.28 billion out, the biggest weekly outflow since June, which flipped the funds' 2026 total to negative. One outlet counts seven straight outflow sessions totaling about 1.91 billion dollars.
The mechanism. When people redeem fund shares, the funds must give up bitcoin to pay them, and that removes demand.
What the data show for it. The flow is real and measurable, and it has run for weeks. One analyst estimate, from a single source, puts the funds' average cost around 81,000 dollars, which would mean most holders are sitting on losses.
What cuts against it. Three things.
First, research from the trading firm DWF Labs, published on Thursday, October 22, 2026, found that fund flows correlate 0.54 with the previous five sessions' price change but only 0.03 with the next five. Its summary was that flows confirm moves and do not predict them. A correlation of 1 means two series move in lockstep and 0 means no relationship. That is vendor research, not peer review, but it points to flows as a consequence of price more than a cause.
Second, these funds trade only during exchange hours. The November 14 fall from about 66,700 to about 62,000 happened when none of them could trade.
Third, size. June's outflow was about 4.5 billion dollars, far larger than this week's, and it coincided with the 2026 low near 57,700, not a collapse.
We could not reach Farside's own site, so the weekly total is confirmed by two aggregators and the split by fund is from a single chain of outlets.
Our reading: the outflow is real, and the data show it following price at least as much as leading it.
Explanation five: forced exits from leveraged bets
This is the one with the best support, and it needs a plain-language explanation first.
Leverage means trading with borrowed money, so a small price move makes a large gain or loss. Crypto exchanges offer a product called a perpetual future that lets traders take leveraged bets on bitcoin rising or falling. If the price moves against a leveraged trader and their cushion runs out, the exchange closes the position automatically, at the market price. That closing is called a liquidation. It matters because a liquidation of a bet on rising prices is itself a forced exit, and forced exits push the price down, which can trigger the next liquidation. That chain is called a cascade.
What the data show. On Monday, November 9, 2026 about 1.15 billion dollars of crypto positions were liquidated over 24 hours, about 1.04 billion of them bets on a rise, according to CoinGlass data reported by The Block. On Friday, November 13, 2026 the figure was about 1.31 billion by midday Eastern, with 83% of it bets on a rise and about 741 million of it in bitcoin, per CoinGlass as reported by CryptoTicker. A tally for the 24 hours to the early morning of Friday, November 13, 2026 put the total at 1.47 billion.
For November 14 and 15 the numbers diverge. One outlet said about 1 billion in 24 hours, another more than 2 billion, and a third about 1.9 billion in the 24 hours to the morning of November 15 in Singapore. They measure different windows with different trackers, and The Block notes that two of the largest exchanges are underreported in these tallies. We do not give a single figure for the weekend. We also decline to use a one-hour figure of 691 million dollars that we could not confirm directly.
There is one more piece of evidence about conditions. The trading firm Talos said spot order-book depth was about 72 million dollars on Monday, November 9, 2026, roughly a third below normal, and that open interest in perpetual futures was in the top 10% of the past year. Both figures reach us through other outlets. A thin order book means each forced exit moves the price more.
What cuts against it. A liquidation follows a drop. It can amplify one and make it faster, but it cannot start one. Something has to push the price down first, and this explanation says nothing about what that was. Also, the trackers disagree by a factor of two on recent days.
Our reading: of the five explanations, this is the best supported as a description of how the fall was amplified. It does not tell you what began it.
The stablecoin signal
A sixth item deserves mention because it is less discussed. Stablecoins are crypto tokens designed to hold a steady dollar value, and traders use them as cash inside the crypto market. Data from the analytics firm Glassnode, reported by The Block on Wednesday, November 11, 2026, showed the total supply of stablecoins fell about 14.2 billion dollars over 30 days, the largest contraction since 2022, to just under 280 billion.
The mechanism: less stablecoin supply means less cash waiting to move into crypto. The problem is that cause and effect can run in either direction. Traders may leave because prices are falling. No source we found separates the two.
Other things that happened
Several other events fell in the same days. We list them without ranking them, because we cannot.
Nvidia's chief executive resigned. Nvidia's filing with the Securities and Exchange Commission, dated Thursday, November 12, 2026, says Jensen Huang resigned as chief executive, president and director, with the chief financial officer, Colette Kress, serving as interim chief executive. One crypto outlet cited it as an overnight trigger for the slide. The timing fits, and no source shows that it mattered for bitcoin. We do not repeat unconfirmed claims about the reason.
MSCI removed Strategy from an index. The index provider announced on Wednesday, November 11, 2026 that Strategy, the company that holds the largest corporate bitcoin position, will leave the MSCI USA Index at the close on Monday, November 30, 2026. Index funds that track it trade at that close, not this weekend. Nothing we found says Strategy must dispose of any bitcoin. The effect on bitcoin would be indirect, through the stock.
Oil and the Iran conflict. An AP report put Brent crude at 95.84 dollars a barrel on Friday, November 13, 2026, up from about 72 when the conflict began in late February. One outlet cited renewed escalation overnight. The risk has been in place for months, so it may explain the level more than this week's timing.
A large exchange theft. On Thursday, October 29, 2026, multiple outlets reported about 6.3 billion dollars of crypto was stolen from the exchange Binance, the largest theft on record, and bitcoin fell about 4% to 5% that day. Whether it still weighs on trading two weeks later is not shown. One outlet cites it as a "lingering effect," and we found no other support for that.
Fear. The Crypto Fear and Greed Index, a sentiment gauge from alternative.me, read 28 on Thursday, November 12, 2026, 20 on November 13 and 13 on November 14. That is "extreme fear." It is a gauge built from price and trading data, so it reflects the fall more than it explains it.
A scorecard
Here is the same analysis in one view.
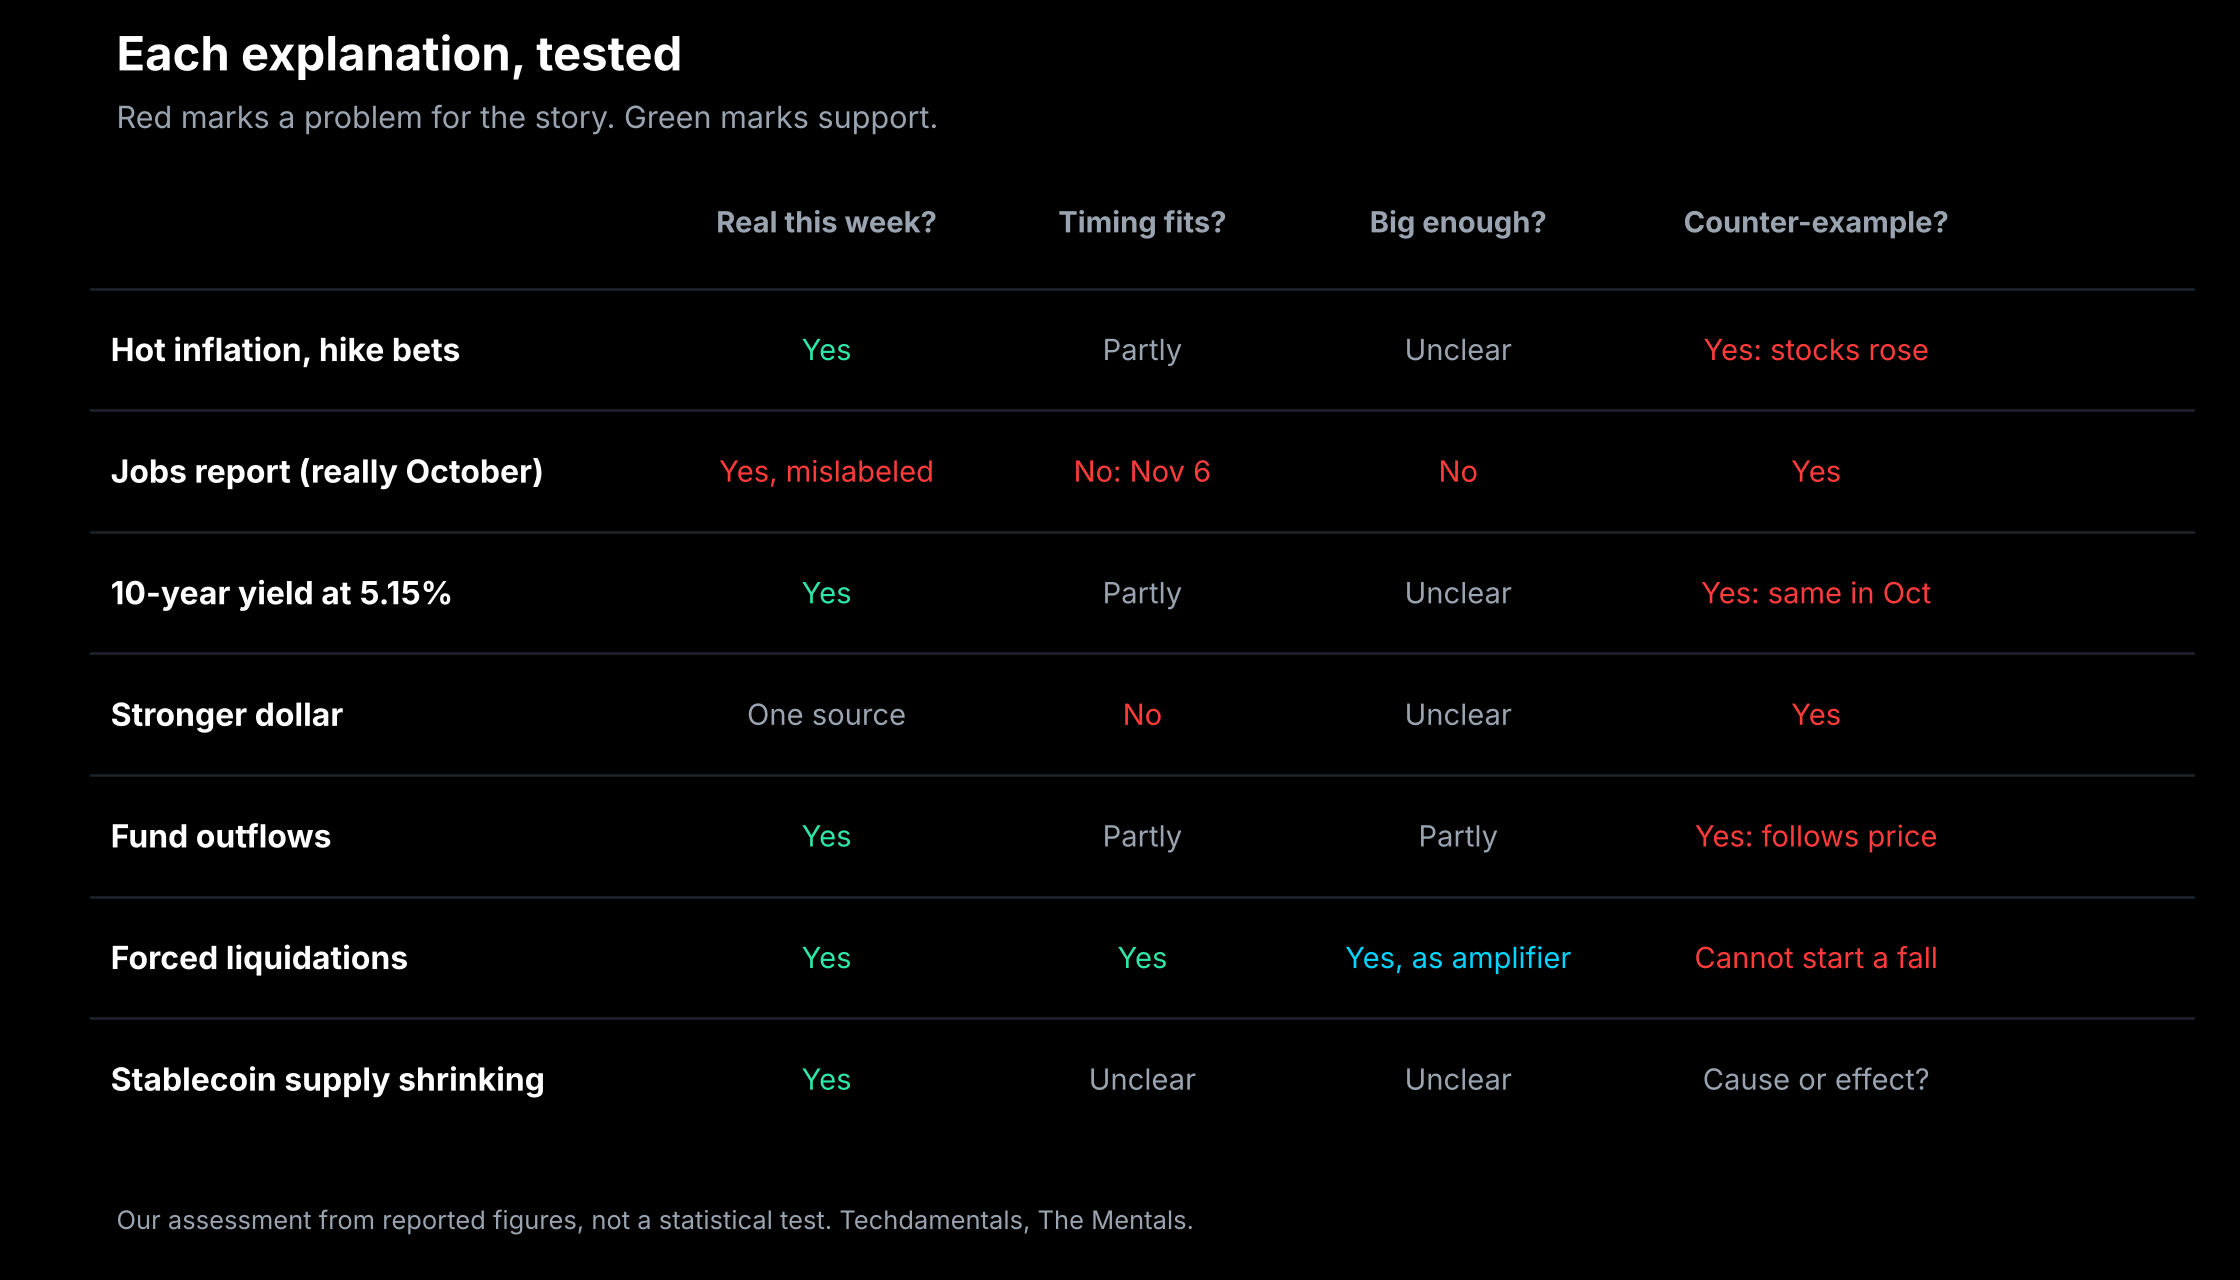
Read the chart with care. It is our assessment from reported figures, not a statistical test, and "partly" means the answer depends on which day you look at.
The longer view
A weekly fall is easy to explain with a weekly news cycle. The longer picture is harder.
Bitcoin is about 50% below its October 2025 high. In that time the Federal Reserve first cut rates and then raised them. By February 2, 2026 bitcoin was around 75,000, roughly 40% below its peak, and by February 6, 2026 it touched about 60,000, all before any hike. It then went to a low of about 57,700 on July 1, 2026, a high of 87,397 on September 21, 2026, and about 62,000 to 64,000 now.
Meanwhile the S&P 500 sits near records at 7,561.67. Over a week the two can move together, and over a year they have come apart. A story that explains this week with this week's data has to also explain why it did not work in the other 51.
That does not mean macro news is irrelevant. It means there is no reason to believe any single piece of news this week is the answer.
How to read a "bitcoin fell because" headline
Here is the checklist we would use.
Find the date of the cause and compare it to the date of the drop. Look at the size of the cause next to the size of the move. Ask whether the same cause was present when the price did not fall. Check whether the number is labeled correctly, since the November payrolls example shows how easily that goes wrong. Look for the source of the figure, and notice when several outlets trace to one origin. And ask whether the cause could be a consequence of the fall, as fund outflows and fear readings may be.
What this does not tell you
It does not tell you what caused the drop. Several things happened at once. Forced liquidations clearly amplified the move, and nothing else is shown to be the trigger.
It does not tell you the low. About 62,000 on spot and 61,970 on CME futures are what the sources support. Different trackers will show different lows.
It does not tell you what happens next. Nothing here forecasts a price or says what bitcoin or any stock is worth.
It does not tell you the dollar's role. The level comes from one outlet.
It does not tell you what the data will look like in a week. Weekend figures come from a thin market, and revisions are common.
The habit worth keeping is to ask of every explanation whether it came first, whether it is big enough, and whether it ever failed to work. Most of the confusion about why a price moved comes from skipping those three questions.
That is the kind of reading that sits under a valuation rather than in a headline. Techdamentals shows the inputs behind every fair value rather than a single number, puts the fundamentals and the chart in one place, and reads the SEC filing to find the real reason a stock moved after earnings.
Try Techdamentals for 3 days, no card needed
This is educational content, not financial advice. Techdamentals is an educational tool and does not recommend any security.