On Wednesday, one company's stock fell 16% and its bonds fell to 80 cents on the dollar. On Thursday the stock recovered 5.94% and closed at $69.69, while the market for insuring its debt went the other way, to a record. Same company, same week, two markets reading it in opposite directions.
The company is CoreWeave, which rents out computing power for artificial intelligence work. But the useful part of this story is not the company. It is that most people watching it had no way to read half the evidence, because the instruments doing the talking are ones almost nobody explains. So here is the explanation, with this week as the worked example.
A bond price and a bond yield are two halves of one fact
When a company borrows in the bond market, it sets a coupon: a fixed annual payment, stated as a percentage of the bond's face value. CoreWeave issued $1.75 billion of notes in April 2026 at a 9.75% coupon, maturing October 1, 2031. They were issued at par, meaning a purchaser paid $100 for every $100 of face value and earned 9.75% a year.
That coupon never changes. What changes is the price someone will pay for the bond today.
As of October 13 those notes traded at 82.688, meaning 82.688 cents for every dollar of face value. The coupon is still 9.75% of the face value. But a purchaser now pays less to get it, and still collects $100 at maturity if the company pays. Less money in, same money out, so the return is higher. That return is the yield, and it was 14.78%.
Here is where almost all of the coverage this week went wrong. Headlines said CoreWeave's borrowing costs had risen toward 15%. They have not. The company still pays 9.75% on notes it has already issued. The 14.78% is what a purchaser at today's discounted price would earn by holding to maturity, assuming they get paid in full. It is the market's price for taking that risk off someone else's hands, not a bill the company receives.
Where it will matter is the next time the company borrows. New debt gets priced off what the existing debt yields, so a 15% secondary-market yield is a preview of what the next deal costs, not a description of the last one.
All four of the company's dollar bonds told a version of the same story on October 13:
| Coupon | Matures | Outstanding | Price | Yield |
|---|---|---|---|---|
| 9.25% | Jun 2030 | $2.0B | 89.68 | 12.86% |
| 9.00% | Feb 2031 | $1.75B | 85.14 | 13.64% |
| 9.75% | Oct 2031 | $2.75B | 82.69 | 14.78% |
| 9.625% | Jul 2032 | $1.25B | 80.04 | 14.88% |
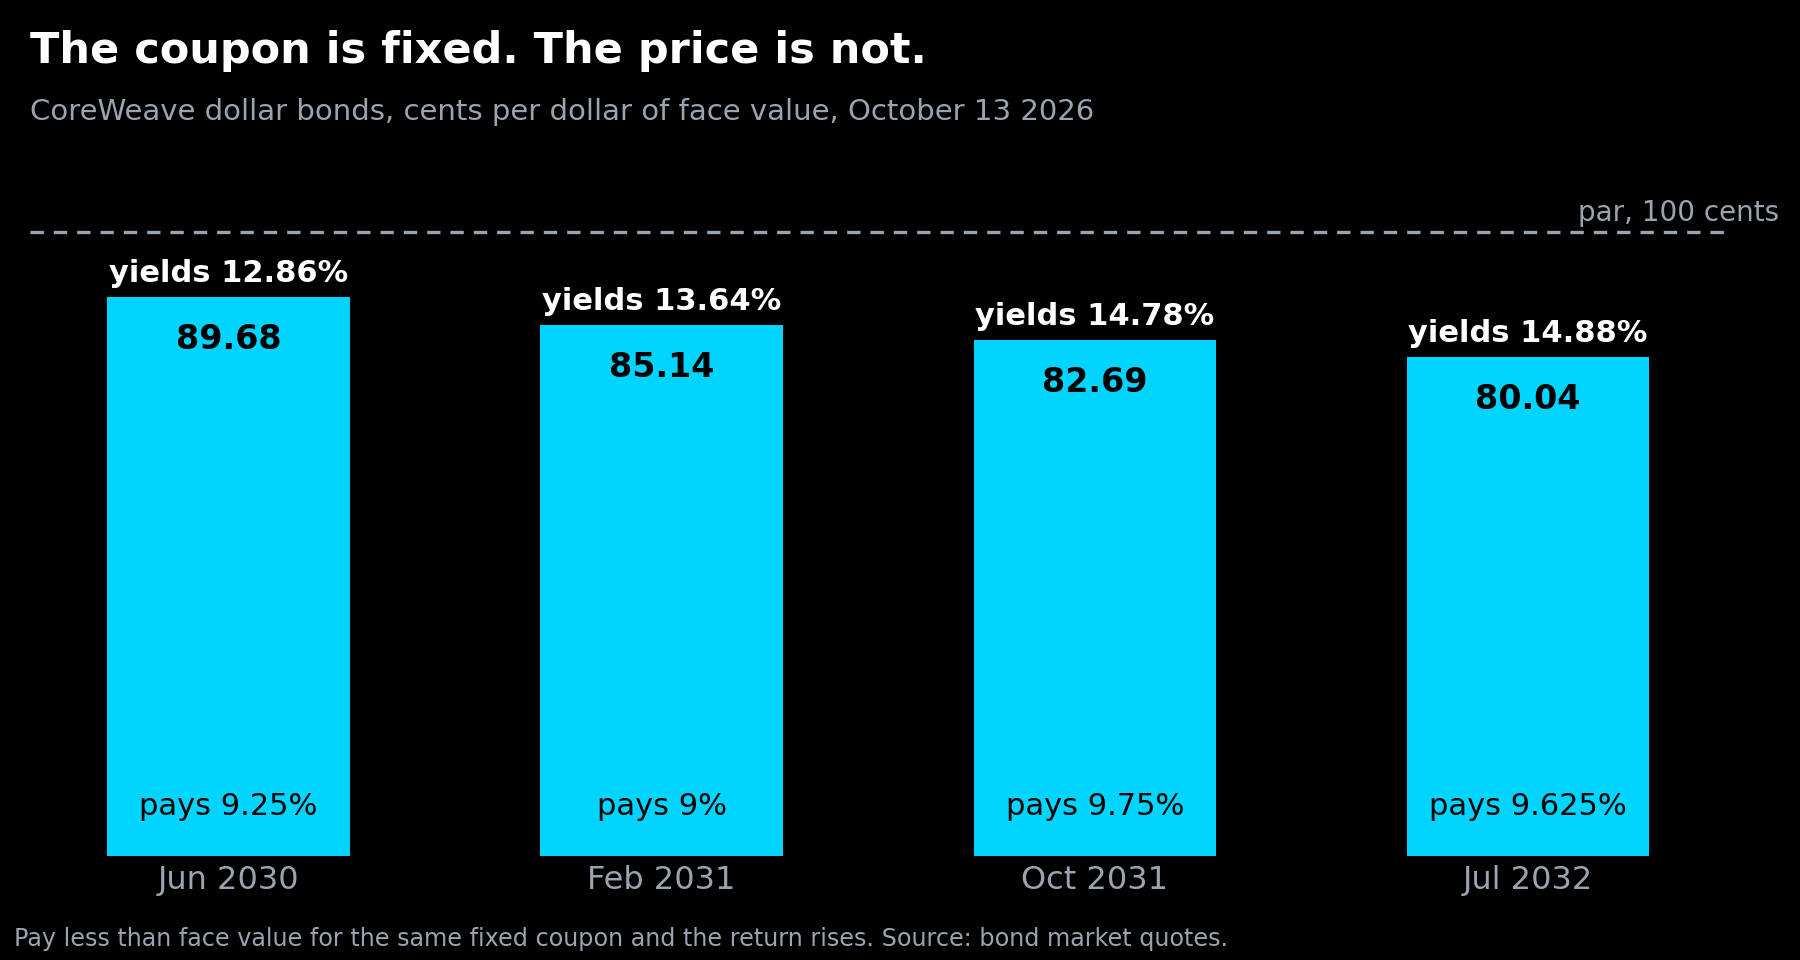
Read the price column top to bottom. The further out the maturity, the less a purchaser would pay. That shape is the market saying the next two years look manageable and the years after them look less so.
A credit default swap is insurance on a loan
The second instrument is the one that hit a record this week, and it is simpler than its name.
A credit default swap is an insurance contract on a borrower. One party pays an annual premium. The other agrees to make them whole if the borrower fails to pay what it owes. The premium is quoted in basis points per year, where one basis point is one hundredth of a percentage point, charged on the amount being covered.
CoreWeave's five-year contracts were quoted near 1,038 basis points on Thursday, a record. In plain terms, covering $10 million of exposure for a year cost roughly $1,038,000. Earlier in the month the same cover cost far less, around 368 basis points on October 6, before more than doubling over the following week.
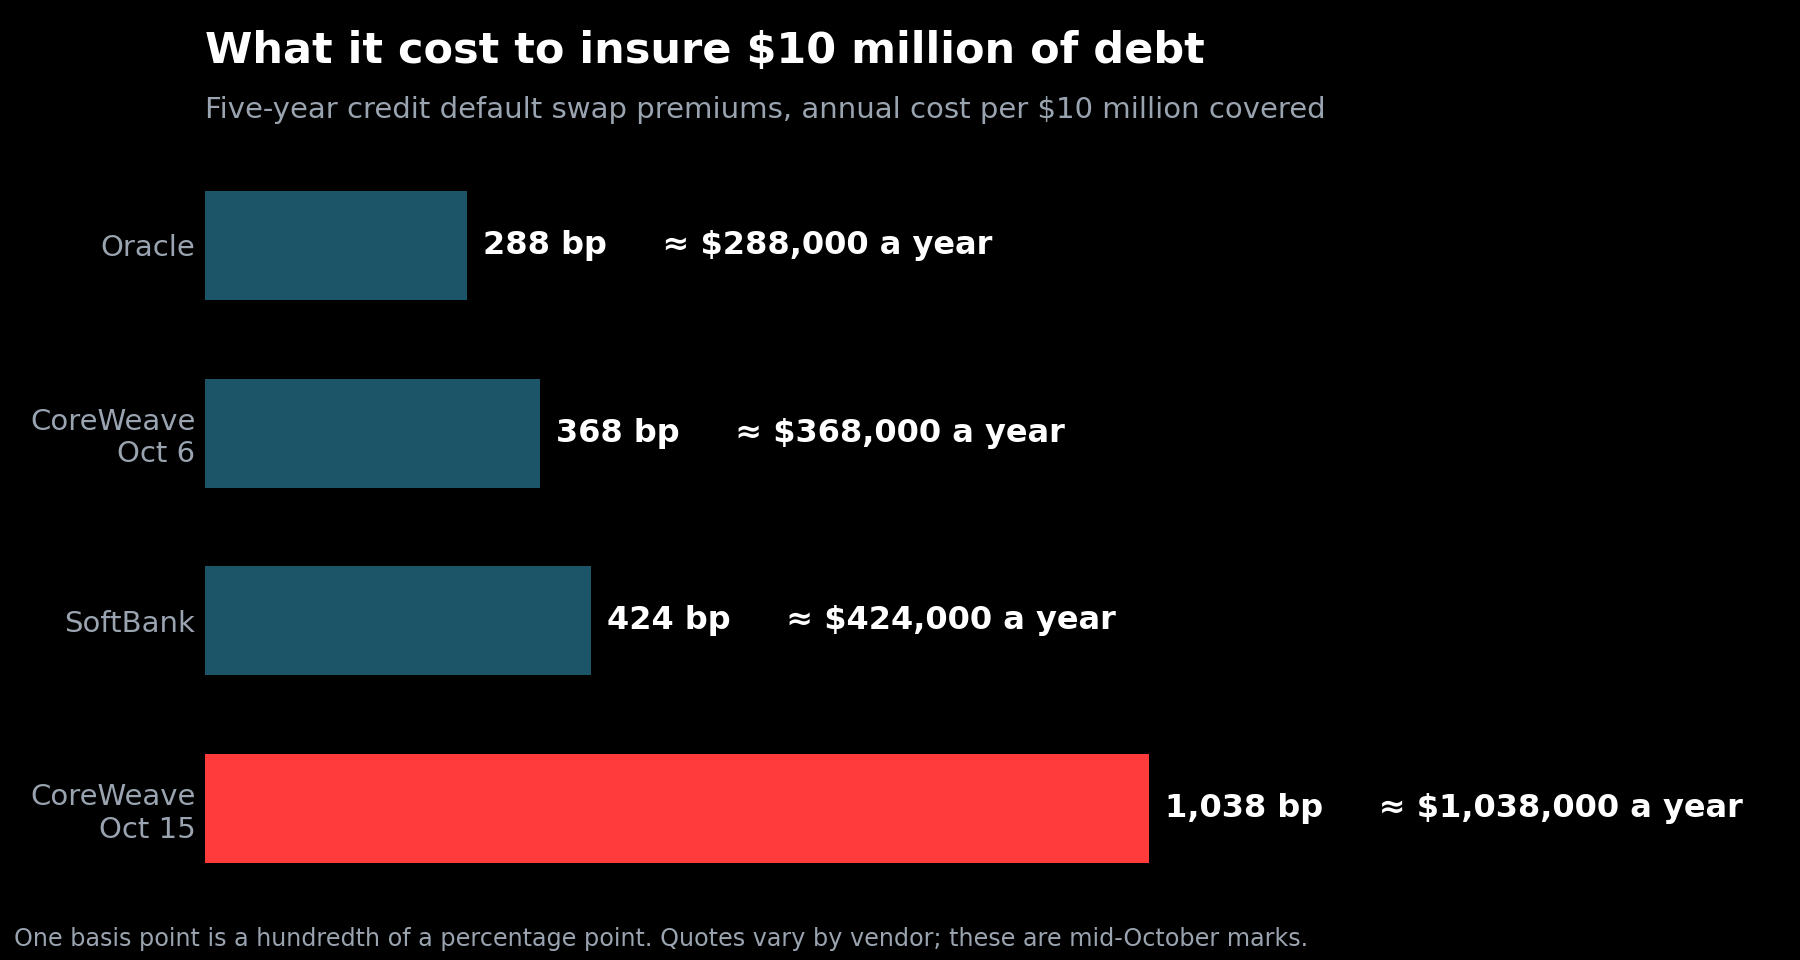
From that premium you can work backwards to a probability. If insuring against failure costs 10.4% a year, the market is charging as though failure is a live possibility rather than a remote one, and the standard conversion puts the implied chance of a missed payment above 60% at some point in the next five years. Oracle's five-year contracts also reached a record, near 288 basis points, and SoftBank's reached 424, so the repricing was not confined to one borrower.
That number deserves a warning label, and it gets one below.
The two markets are asking different questions
This is the part worth carrying away. Stock investors and bond investors were not disagreeing about the facts this week. They were answering different questions about the same facts.
A shareholder owns whatever is left after everyone else is paid, so the question that matters is how large the business can get. On that question the news was encouraging. The contracted order book runs to roughly $129 billion, with Meta accounting for about 27% of it and OpenAI about 17%, and customers frequently prepay around half a contract's value up front. One large bank kept its most positive rating on the shares this week on exactly that reasoning: that contracted revenue grows into the debt.
A bondholder does not own the upside. They own a promise of specific payments on specific dates, so the only question is whether those payments arrive on time. On that question the same bank's own model is sobering. It projects negative free cash flow of roughly $67 billion between 2026 and 2028, funded by about $59 billion of new borrowing, with interest expense climbing from about $3.08 billion in 2026 to $5.90 billion in 2028, and operating profit not fully covering interest until 2028.
Both readings can be correct at once. A company can be growing into its obligations and still be one tight financing window away from trouble, and whether that window stays open is not something the business controls. Total debt stood near $35 billion at the end of June against roughly $16.5 billion of lease liabilities. The chief executive called the week's reaction irrational and said the order book more than covers the debt. The credit market was not arguing with the order book. It was pricing the gap between when the interest is due and when the revenue shows up.
One reading of the week, offered as a reading: when a company funds long-dated assets with borrowed money, the credit market tends to react before the equity market, because it is watching the thing that breaks first.
What this does not tell you
Start with the headline number, because it is the softest thing here. Credit default swaps trade over the counter rather than on an exchange, so there is no single official price. On Thursday one vendor's data put the intraday peak near 1,194 basis points while others settled near 1,038. Quoting a figure to the basis point implies a precision that does not exist.
A spread is also not a pure measure of risk. It mixes the market's view of the borrower with demand from people hedging unrelated positions and with how thinly the contracts trade. When few contracts change hands, a modest amount of demand moves the quote a long way, which is one reason a spread can double in nine days without any new information about the company.
The implied probability is a convention, not a forecast. Converting a premium into odds requires an assumption about how much a lender would recover after a default, and changing that assumption changes the answer. Treat "above 60%" as a description of what insurance costs, not as a prediction.
A bond at 82 cents is not a verdict either. It is simply a price at which one party was willing to take a risk another party wanted to be rid of. Prices like that have been wrong in both directions before.
And none of it says anything about where the share price goes. The credit market and the equity market were pointing opposite ways this week, and nothing in this issue resolves that. The point is only that you can now read both.
Debt and interest costs are not footnotes to a valuation, they are inputs to it. When Techdamentals values a company, it shows the figures it used next to the result: free cash flow, debt and cash, shares outstanding, beta and the discount rate, alongside the year-by-year projections. When a balance sheet is doing the heavy lifting in a story like this one, those are the lines worth looking at yourself.