On Thursday, October 22, the interest rate on 10-year US government bonds, which are loans to the government that it pays back with interest, fell to 4.96% from 5.13% the day before, and technology stocks fell sharply the same day. Lower rates are normally good news for stocks, so that looks backwards. It isn't, and working out why is the easiest way to understand what the Federal Reserve's rate hikes do to the stock market.
What the Fed actually did
The Federal Reserve, usually called the Fed, is the US central bank. It is the government body in charge of the country's money supply and borrowing costs. Its main tool is one interest rate, the federal funds rate, which is what banks charge each other for overnight loans. That rate sets the floor under most of what everyone else pays, including credit cards, car loans and business loans.
The Fed cut that rate three times in 2025, the last time in December, and then left it at 3.50% to 3.75% through its July 29, 2026 meeting. On September 16 it raised the rate by a quarter of a percentage point, to a range of 3.75% to 4.00%. The vote was 12 to 0, and it was the first increase since July 2023. Fed Chair Kevin Warsh, who took the job in May, pointed to three changes since July: a strong job market, inflation that stayed high over the summer, and an energy price shock tied to the war with Iran.
Inflation is how fast prices rise from one year to the next, and the Fed's goal is 2%. On October 14 the government reported its latest reading, the consumer price index, which tracks what a typical basket of everyday goods and services costs. Prices in September were 3.7% higher than a year earlier. Economists had expected 3.6%, and August's figure was 3.4%. That puts inflation at nearly twice the Fed's goal.
Most of the pickup came from fuel. Gasoline prices rose 9.1% in September alone, and gasoline accounted for more than half of the month's increase. If you take out food and energy you get core inflation, which is everything else the index tracks, roughly four-fifths of it, from rent and car repairs to clothing and doctor visits. Core came in at 2.6%, a tenth above forecasts and up from 2.4% in August.
A rate hike cannot lower the price of oil. What it can do is slow down how much everyone else spends, which takes some pressure off other prices. That is the whole reason the Fed uses it, and it is also why stocks care.
Three ways higher rates push on stock prices
It helps to keep these separate, because they work differently.
Borrowing gets more expensive. A restaurant owner who borrowed to open a second location pays more interest on that loan, which leaves less profit. A family carrying a credit card balance pays more within a statement cycle or two. Spread that across millions of businesses and households and spending slows, which is the point of a hike. Slower spending means smaller profits for a lot of companies.
Safe investments pay more. When you lend money to the US government for ten years, what you hold is called a bond, and what it pays you each year, shown as a percentage of the price, is called the yield. The 10-year Treasury yield is that number for the government's ten-year bond. It is about as safe as investing gets, and on October 7 it touched 5.36%, the highest in 24 years. The last time it was that high was 2002. When the safe option pays that much, a stock, which is a small piece of ownership in a company, has to offer a good enough reason to take more risk.
One thing that trips people up is that the Fed does not set that 10-year rate. The Fed sets the overnight rate. The 10-year yield is set by traders in the bond market, based on what they think inflation and the Fed will do over the next decade. Fixed mortgage rates follow it more closely than they follow the Fed's own rate. The two usually move together, but not always, and Thursday was one of the days they didn't.
Profits far in the future shrink the most. To put a value on a company, analysts estimate the cash it will earn in each coming year and then shrink the later amounts, because money you receive later is worth less than money you receive today. If you had it now, you could earn interest on it in the meantime. The size of the shrinking is set by an interest rate that analysts call the discount rate.
Say that rate is 4%. Then $100 that arrives one year from now is worth about $96.15 today. At 5% it is worth about $95.24, so the one-point increase takes away less than a dollar. Now take $100 that arrives ten years from now. At 4% it is worth about $67.56 today, and at 5% it is worth about $61.39. That is a loss of about 9%. The same one-point rise costs far more when the money is far away.
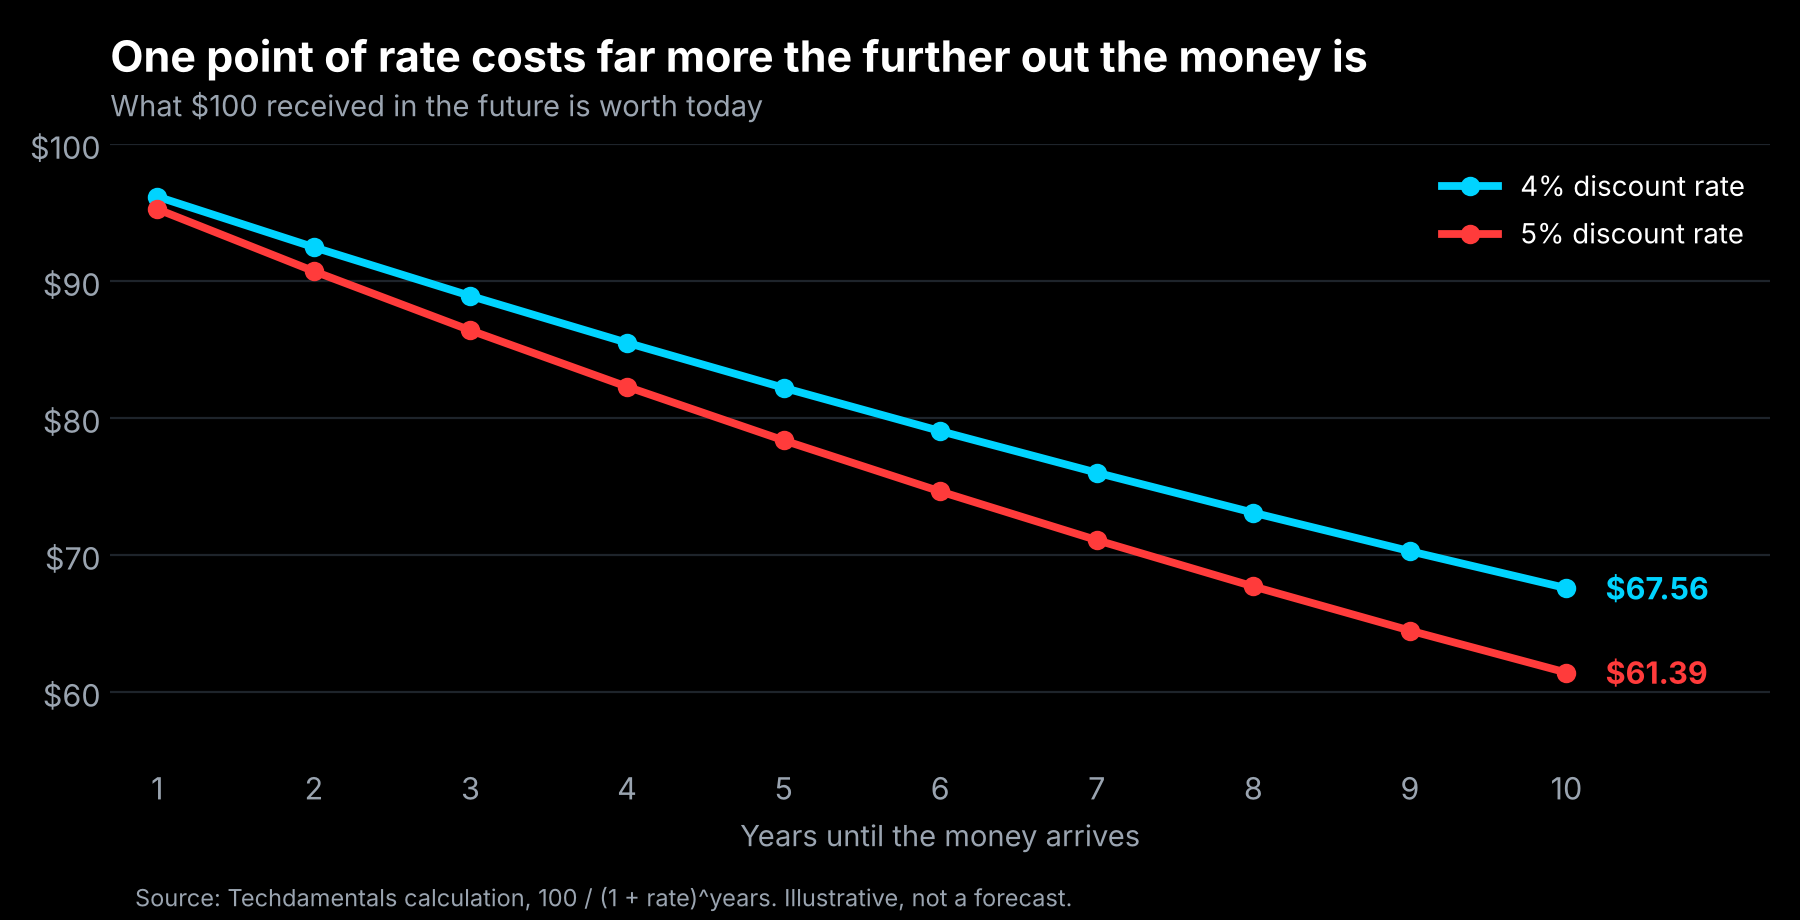
This is why stocks of fast-growing companies, whose biggest profits are expected years from now, tend to react more to rate worries than companies earning solid profits today.
Why the hike itself is not the whole story
Stock prices reflect what investors expect to happen, not only what has already happened. If everyone sees a hike coming, prices have often adjusted by the time it arrives. Before the Fed's announcement on September 16, a tool from the CME Group called FedWatch, which turns traders' bets on where interest rates are headed into odds, put the chance of a hike at about 93%. So the hike was not a surprise. What mattered was what came next.
In its projections that day, which are each official's own forecast of where rates are headed, 16 of the 18 officials who submitted one said at least one more hike this year was possible. The minutes of the meeting, the written record the Fed publishes afterward, released October 7, said most officials judged another increase would likely be appropriate by the end of the year.
Right now traders see the Fed holding rates steady at its October 27 and 28 meeting as very likely, and they lean strongly toward another hike in December. Different tools give different exact odds, so I am leaving the numbers out. That is what the market is pricing, not something the Fed has decided. Warsh has also stopped telling markets in advance what the Fed plans to do, a practice called forward guidance, so traders get fewer hints than usual.
The stock market did not fall apart after the September hike. The S&P 500, a list of 500 of the largest US companies that is used to track how the stock market is doing (a list like that is called an index), closed, meaning finished the trading day, above 7,800 for the first time on October 6, about three weeks later, and set a record close that day. Since then stocks have pulled back some, with the 24-year high in yields and doubts about whether spending on artificial intelligence will pay off both in the news.
So why did stocks fall when the yield fell?
Back to Thursday. A bond pays a fixed amount of interest. If more people want the bond, its price rises, and that fixed payment becomes a smaller percentage of the higher price, so the yield falls. A yield and a price always move in opposite directions.
Reports on Thursday tied the drop in the 10-year yield to investors moving money out of technology stocks linked to artificial intelligence and into government bonds. That means the yield fell because investors were nervous, not because they felt relaxed about rates. One reading is that the stock move and the bond move were the same story. That is a reading rather than a proof, because I cannot see why each investor made each trade, and the Fed was still expected to raise rates again by year-end.
What history says about hikes and stocks
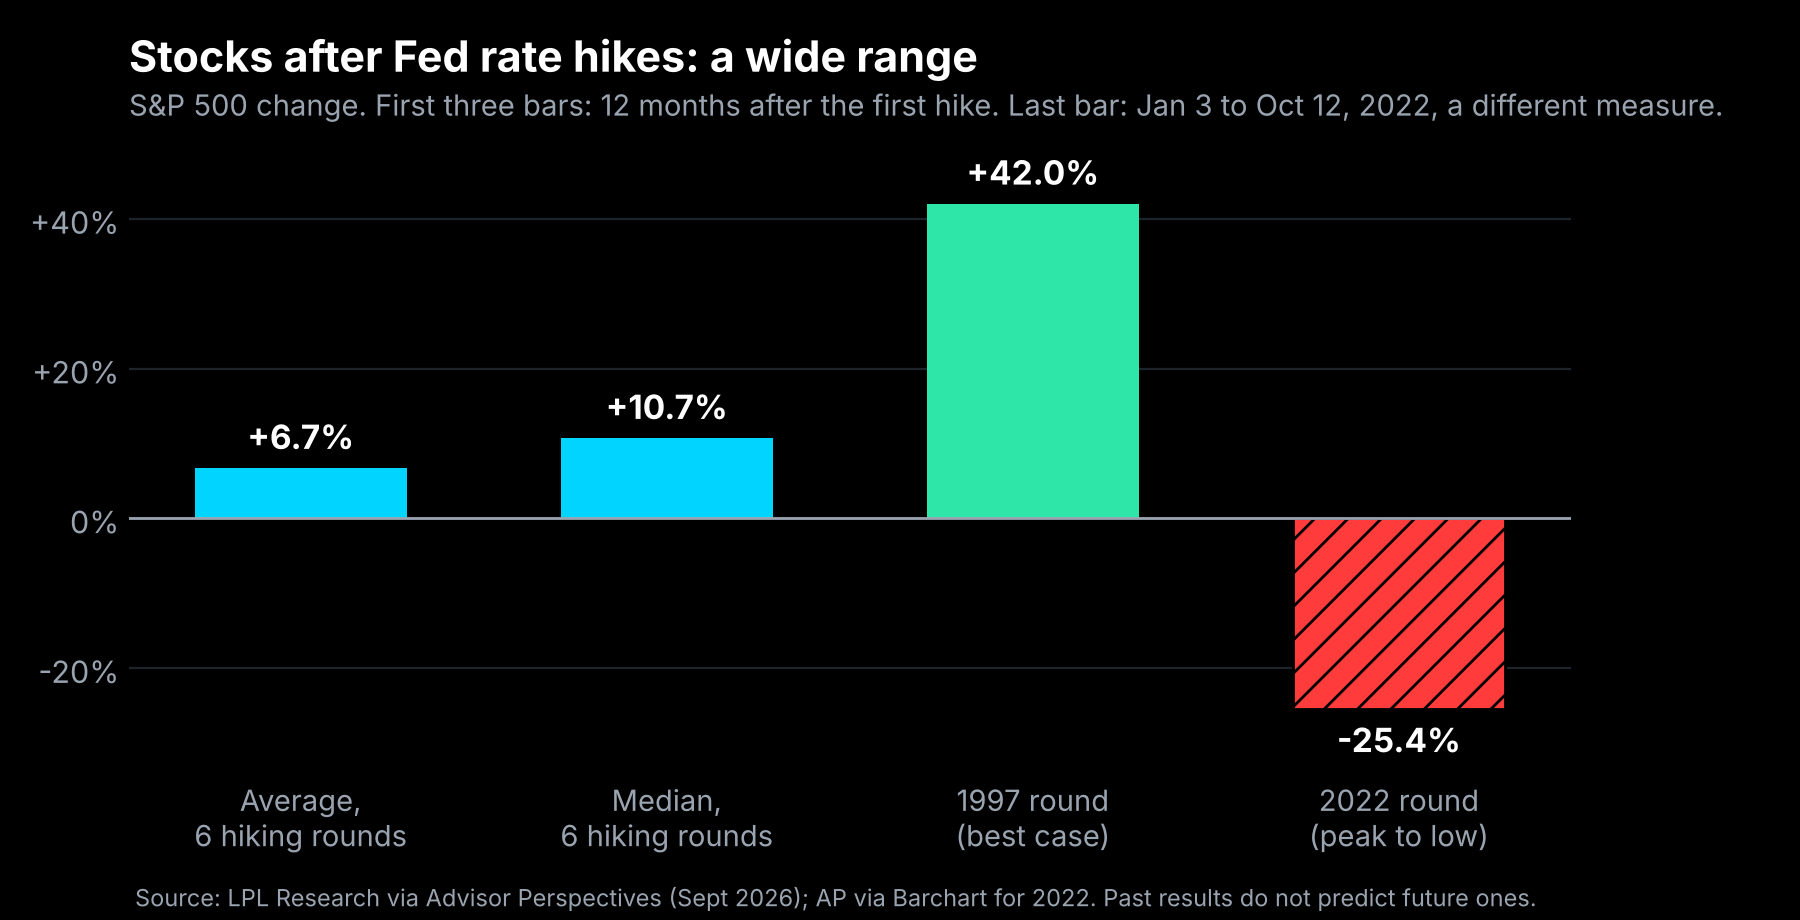
One firm's study of the S&P 500 looked at the six times since 1994 that the Fed started a round of hikes: 1994, 1997, 1999, 2004, 2015 and 2022. Stocks generally struggled for the first several months. On average, returns were negative through the first four months and improved significantly by months five and six. Twelve months after the first hike, the S&P 500 was up 6.7% on average and 10.7% in the median case. The median is the middle result, so half the rounds did better than that and half did worse.
The range is wide. After the first hike in 1997 the S&P 500 was up 42% a year later. In 2022 the Fed took rates from near zero to their highest level since 2007 in about a year, and the S&P 500 fell 25.4% from its record close on January 3 to its low on October 12. A fall of 20% or more from a recent high is called a bear market, and that one lasted nine months. Inflation was far worse then. The consumer price index hit 8.6% in May 2022, a 40-year high.
The 2015 to 2018 round sits in the middle. The Fed raised rates from 0.25% to 2.5%, and the S&P 500 ended that stretch higher than it started, but it came close to a bear market before it bottomed on Christmas Eve 2018.
What do Fed rate hikes do to stocks?
A rate hike pushes on stocks in three ways. It makes borrowing more expensive, it makes safe investments pay more, and it shrinks the value of profits expected far in the future. How much of that shows up in stock prices depends on what investors already expected. A hike everyone saw coming can move prices very little, while a surprise, or a sign that more hikes are coming, can move them a lot.
Historically, stocks have usually been weak for a few months after the first hike and then improved in most rounds, but the range is wide, from a 42% gain in the year after the 1997 hike to a 25.4% drop during the 2022 round.
What this doesn't tell you
Six hiking rounds is a small sample, and an average across them hides a lot. The 2022 decline came with inflation at 8.6% and rates starting near zero. Today inflation is 3.7% and rates are already near 4%, so that round may not be a good guide in either direction.
It also does not separate causes. In the weeks since the hike, yields hit a 24-year high, oil prices rose, and doubts about artificial intelligence spending grew, all at once. The strongest case against this article is that stocks are reacting mostly to the spending doubts and that rates are a side story. The record close on October 6, three weeks after the hike, points that way. I cannot rule it out.
And it does not tell you what the Fed will do on October 28 or in December, or where stocks go from here. The odds above are what traders are pricing today, and they have swung a lot in the past month.
Valuing a company comes down to the same step described above: estimate the cash it will earn, then shrink the later years with a discount rate. The Techdamentals IV Calculator shows the discount rate it used on each company, next to the price, cash flow, debt and growth numbers behind the fair value range, so you can see what a result depends on.