The October jobs report landed on Friday, November 6, 2026, and by any normal standard it was strong. American employers added 165,000 jobs. The forecast was around 60,000. Of the 79 economists surveyed by Bloomberg, not one had a number that high. The most optimistic guess was 131,000.
Unemployment fell. The labor force grew. Two earlier months were revised upward by 84,000 jobs between them.
And the average hourly wage, measured against the same month a year earlier, grew 3.12%, while prices in the most recent reading grew 3.7%.
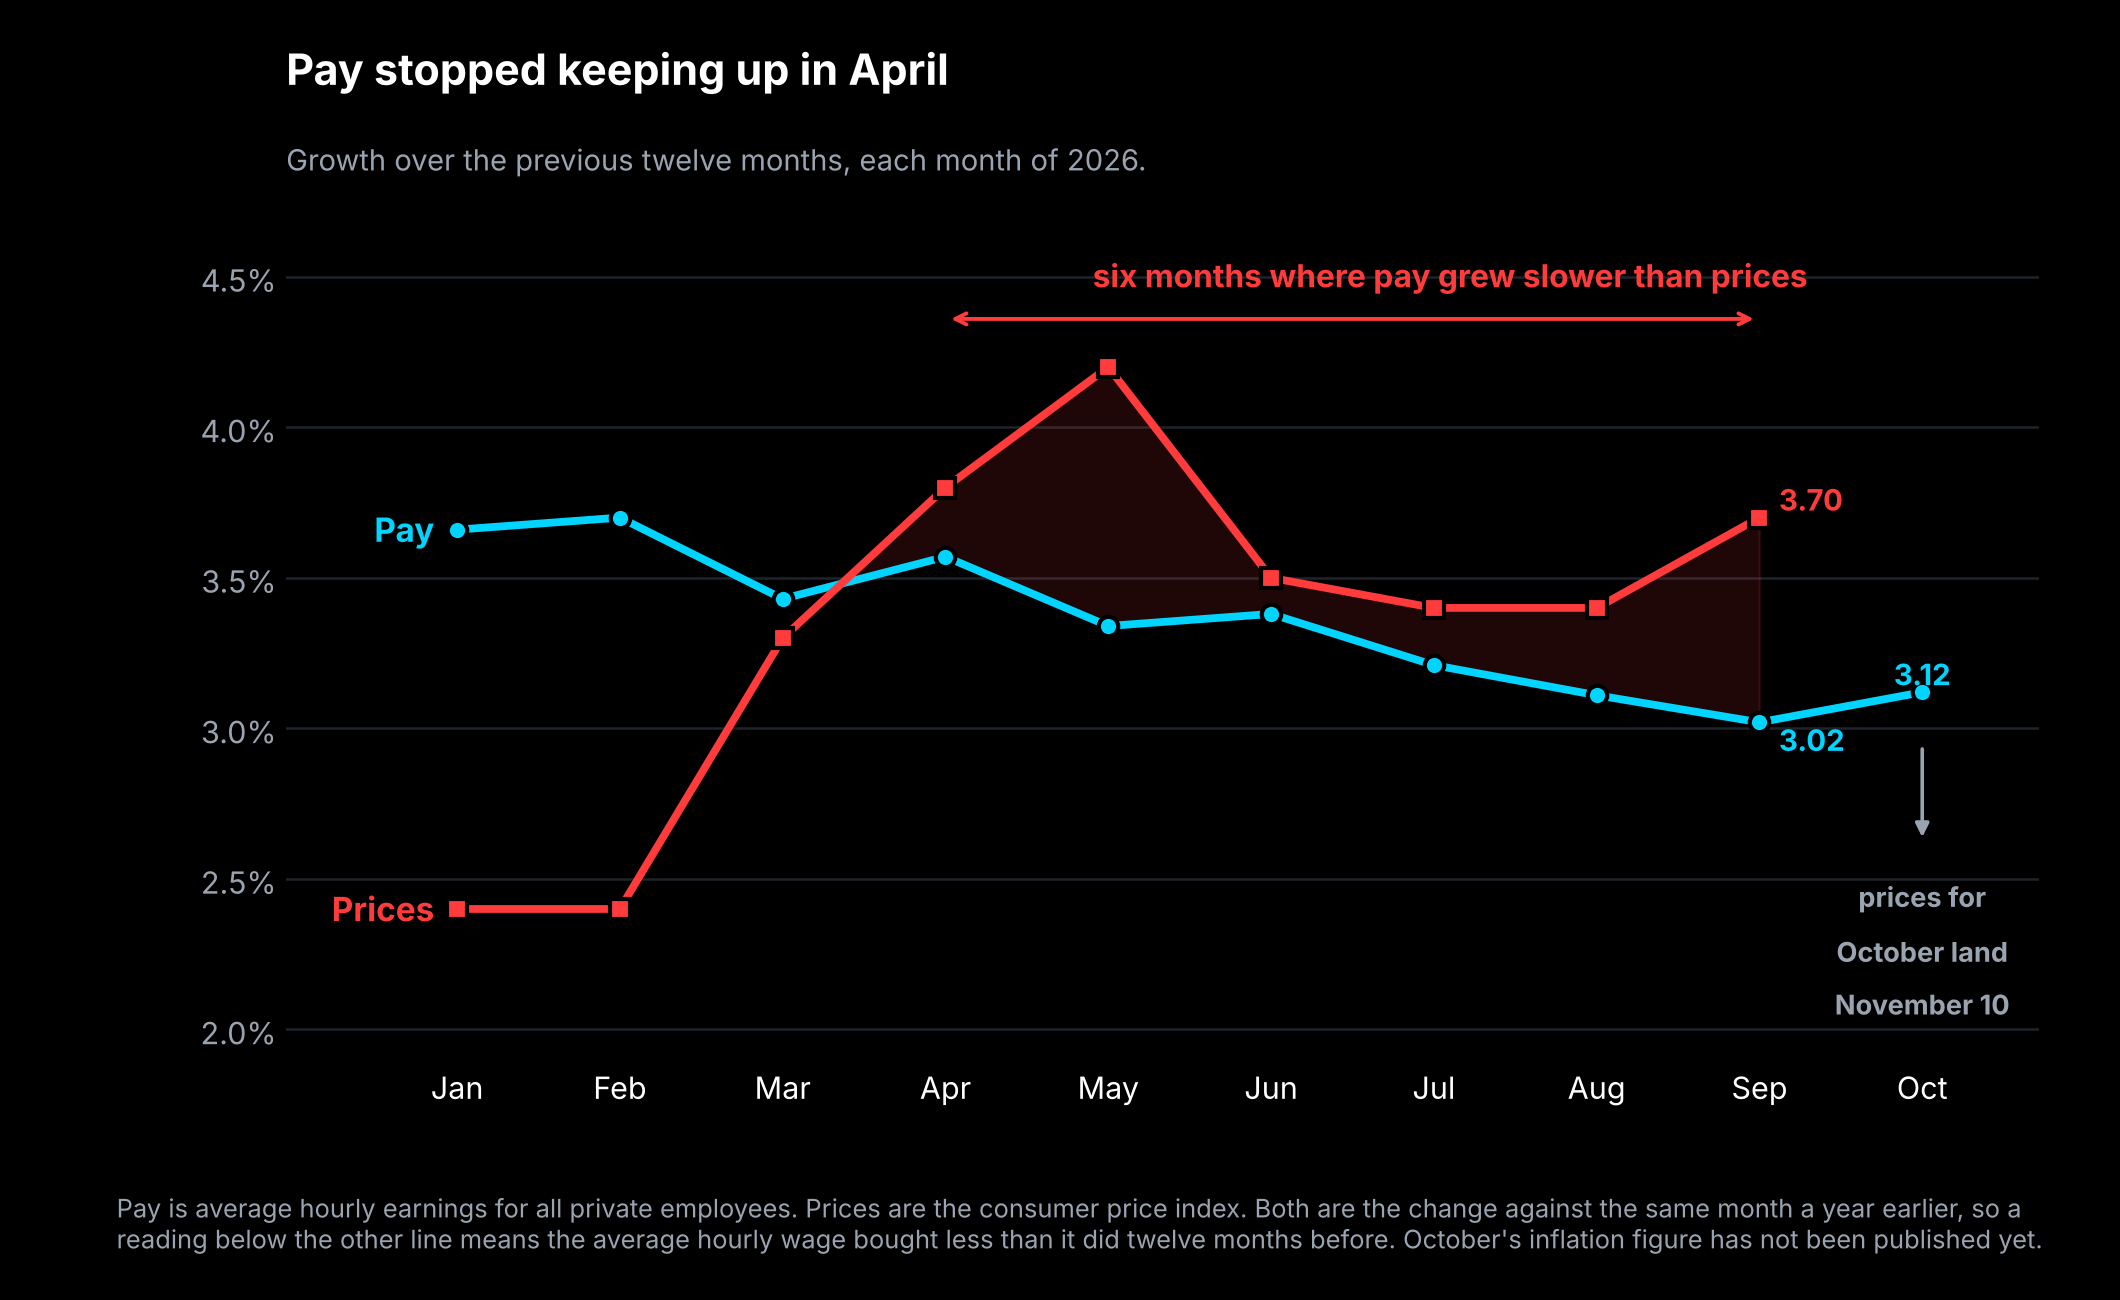
That gap is the thing worth your attention, because it has now been there for six consecutive months, and it is not something you would learn from any headline written about this report.
What the report is, and where the numbers come from
Every month the Bureau of Labor Statistics, a federal agency that counts things about work and prices, publishes something called the Employment Situation. It is built from two separate surveys, and almost every confusing thing about jobs coverage traces back to the fact that there are two.
The first is the establishment survey. The government asks businesses how many people were on their payroll. This produces the headline number, the one reported as "the economy added X jobs." It counts jobs, not people, so somebody working two jobs is counted twice.
The second is the household survey. The government calls households and asks who is working, who is looking, and who has given up. This produces the unemployment rate. It counts people, not jobs.
The two surveys measure overlapping things in different ways and they frequently disagree. This month they agreed, and both were strong.
The headline numbers, taken seriously
Here is what the report said.
| October 2026 | What was expected | |
|---|---|---|
| Jobs added | 165,000 | about 60,000 |
| Unemployment rate | 4.1% | 4.2% |
| Average hourly earnings, vs a year ago | 3.12% | about 3.0% |
| Labor force participation | 61.9% |
A word on consensus, which is the number everyone compares against. It is the average of what professional forecasters expected. Different organizations survey different economists and get different answers. For this report, Dow Jones had 59,000, Bloomberg had 62,000 and Reuters had 65,000. We are using "around 60,000" because quoting the lowest of three would make the beat look bigger than it was, and that is exactly the kind of thing this newsletter exists to catch.
Then the revisions. Each month the government updates its two previous estimates as more businesses report in. August was revised up from 133,000 to 186,000. September was revised up from 29,000 to 60,000. Together that is 84,000 jobs that existed all along and were only counted now.
Revisions are normal and they are not a scandal. They happen because the first estimate is built from the businesses that answered quickly, and the rest trickle in. What is worth knowing is that for most of this year revisions ran the other way, downward. This month they did not.
Labor force participation is the share of adults either working or actively looking for work. It rose to 61.9%. A rising number here is generally a sign of confidence, because people tend to start looking when they think there is something to find.
So this was a strong report. We are not going to pretend otherwise, and anyone telling you the jobs numbers were secretly terrible is working backwards from a conclusion.
The problem is somewhere else.
Nominal and real, which is the whole issue
When you hear that wages rose 3.12%, that is a nominal figure. Nominal means the raw number of dollars, before accounting for what those dollars will cover.
Real means after accounting for prices. If your pay went up 3% and the things you pay for went up 4%, your nominal pay rose and your real pay fell. You have more dollars and less of everything else.
This distinction sounds academic and it is the single most important idea in reading economic news, because nearly every headline figure is nominal and nearly every question you actually care about is real.
The measure used for prices here is the consumer price index, usually shortened to CPI. The government tracks the cost of a fixed basket of goods and services, food, rent, gasoline, insurance, haircuts, and reports how much that basket's price changed. The most recent reading, for September 2026, was 3.7% higher than a year earlier.
Put the two side by side. Pay up 3.02% in September. Prices up 3.7%. The average hourly wage bought about 0.7% less than it did twelve months before.
Six months, not one
One month would be noise. This is not one month.
| 2026 | Pay growth | Price growth | Difference |
|---|---|---|---|
| January | 3.66% | 2.4% | +1.26 |
| February | 3.70% | 2.4% | +1.30 |
| March | 3.43% | 3.3% | +0.13 |
| April | 3.57% | 3.8% | -0.23 |
| May | 3.34% | 4.2% | -0.86 |
| June | 3.38% | 3.5% | -0.12 |
| July | 3.21% | 3.4% | -0.19 |
| August | 3.11% | 3.4% | -0.29 |
| September | 3.02% | 3.7% | -0.68 |
| October | 3.12% | not yet published |
The crossover happened in April 2026. Every month since, pay growth has come in under price growth.
Now read down the pay column on its own. February 3.70%, then 3.43, 3.57, 3.34, 3.38, 3.21, 3.11, 3.02. Wage growth has been slowing all year, in a labor market everybody describes as strong. October's 3.12% is the first month that ticked up since February, which is genuinely good news and also a single month.
There is a live question attached to this. October's inflation figure is published on Tuesday, November 10, 2026. Pay grew 3.12% in October. If prices came in at or below that, the streak ends at six. If they came in above it, it reaches seven. That is a real thing to watch rather than a settled fact, and we would rather tell you the question than pretend we know the answer.
Where the jobs actually came from
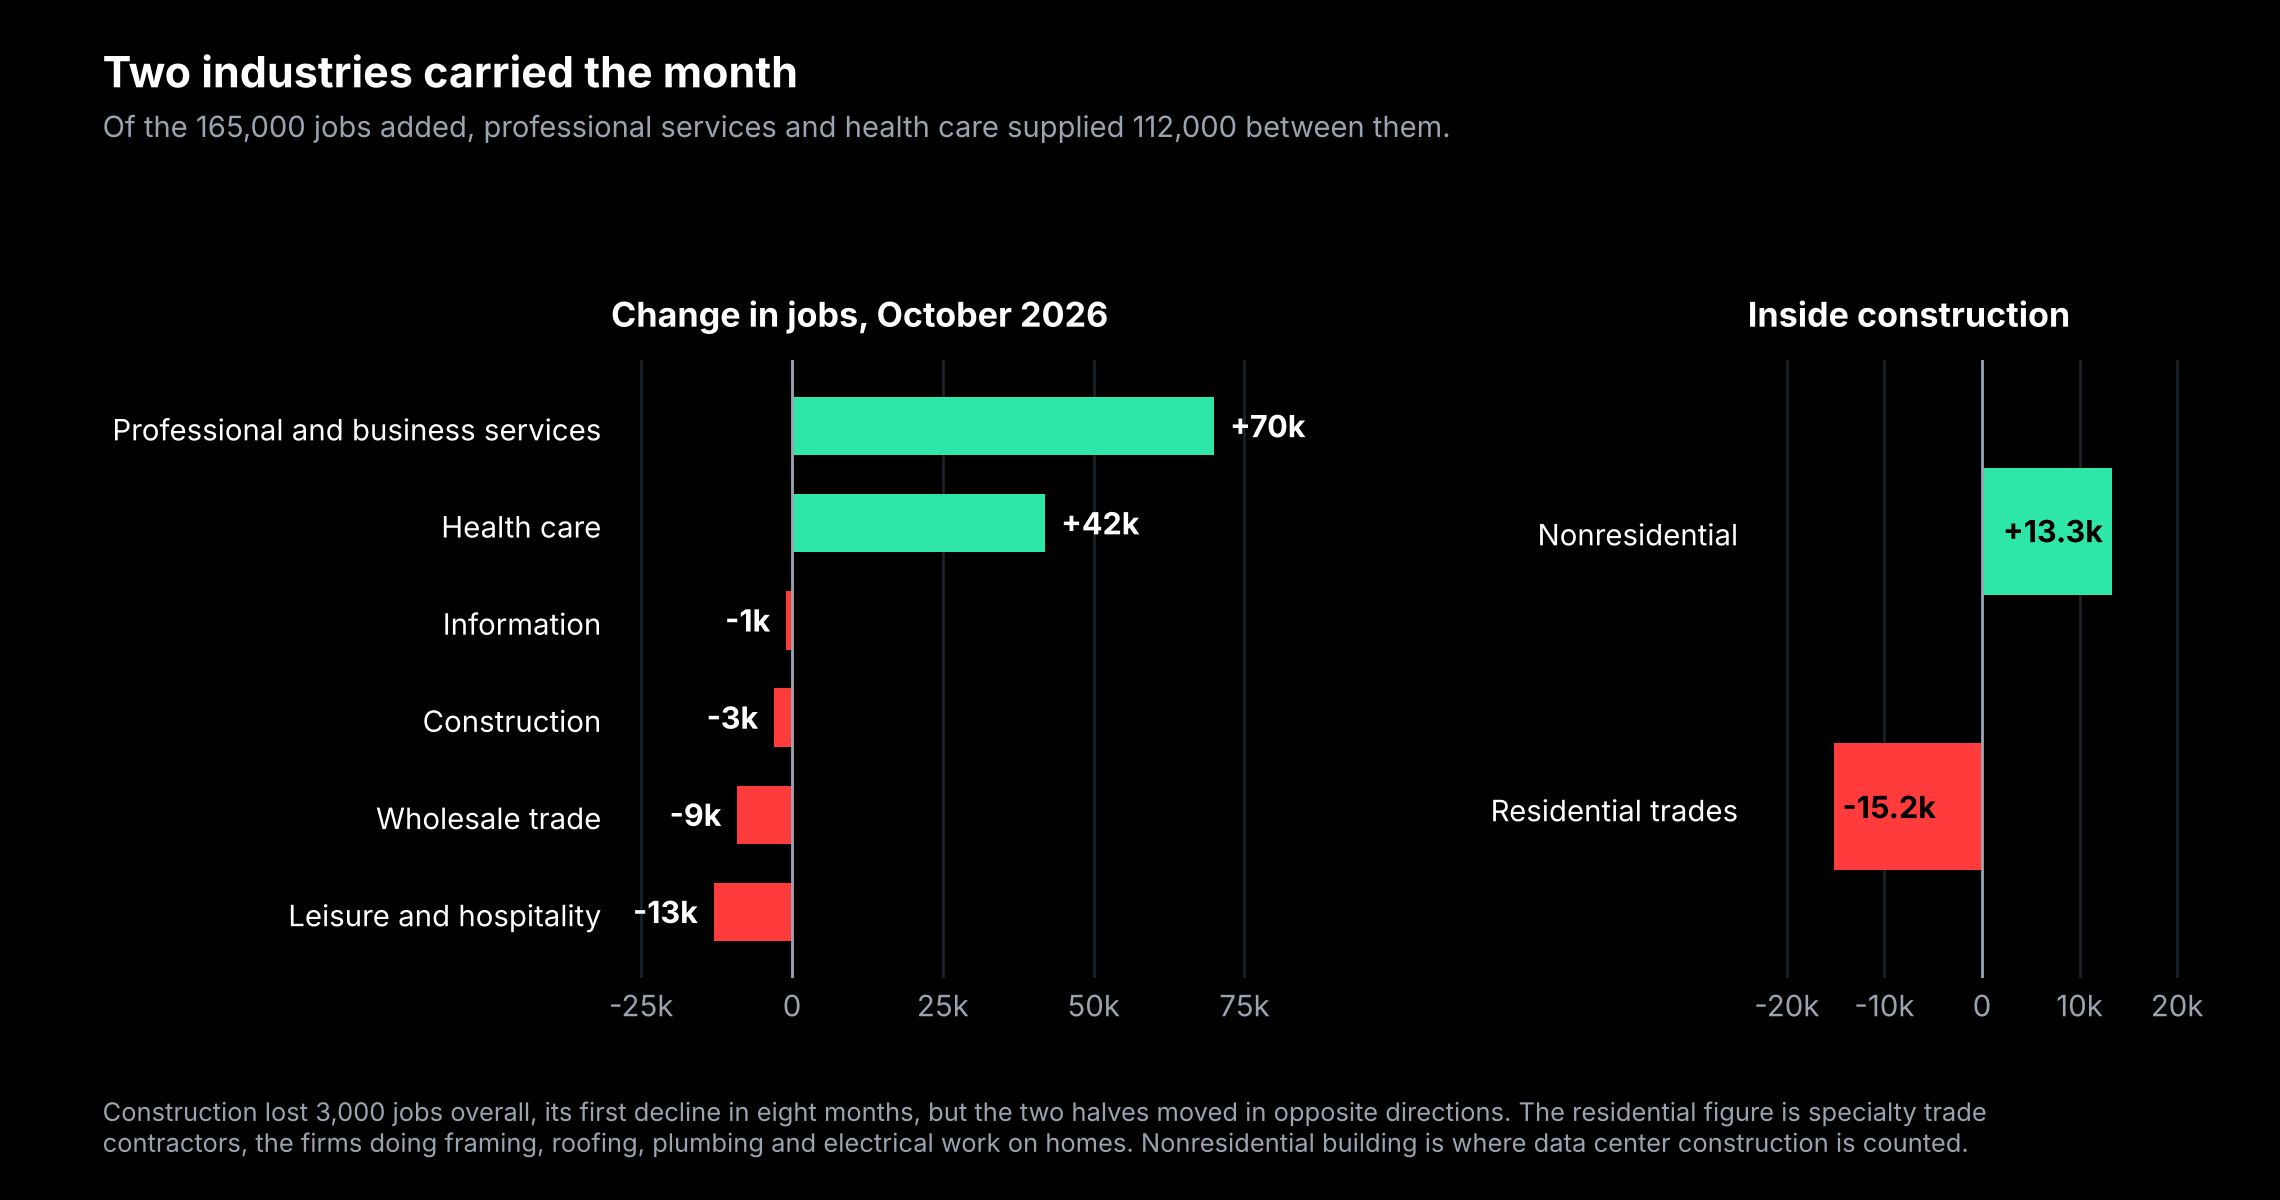
A second thing the headline hides. 165,000 is a total, and totals average things together that are moving in opposite directions.
Professional and business services added 70,000 jobs, the most since July 2022. Health care added 42,000. Between them, those two supplied 112,000 of the 165,000.
Meanwhile leisure and hospitality, which covers restaurants, bars, hotels and entertainment, lost 13,000. Wholesale trade lost 9,100. Information lost 1,000. Construction lost 3,000, its first decline in eight months.
A labor market where two industries carry two thirds of the hiring is narrower than one where gains are spread across the economy. It is not a crisis. It is a fact about the shape of the growth, and shape matters because it tells you who is actually getting hired.
Construction is the most interesting line in the whole report, because the total hides a split running in two directions at once. Residential specialty trade contractors, meaning the firms that do framing, roofing, plumbing and electrical work on houses, lost 15,200 jobs. Nonresidential construction added 13,300.
Nonresidential is where data center building is counted.
So the construction industry is shedding the people who build homes and hiring the people who build warehouses full of computers. One line, two economies. If you have followed our data center coverage, this is that story showing up in the employment data.
Easy to have a job, hard to get one
One more number that complicates the picture.
The median length of unemployment reached 11.9 weeks, the longest since November 2021. More than a quarter of unemployed people, 27.6%, have been out of work for more than six months.
Those two facts sit oddly next to a falling unemployment rate, and together they describe something specific. If you have a job, you are unlikely to lose it. If you lose one, it is taking longer than it used to to find the next. Low firing and slow hiring produce a low unemployment rate and a miserable experience for anyone actually looking.
Also worth noting: federal government employment is at 2.677 million, the lowest since May 1966, down 336,000 from its October 2024 peak, a decline of 11.2%.
Why a strong report is bad news for stocks
This is the part that confuses people, and the logic is worth walking through because it runs backwards from intuition.
The Federal Reserve is the central bank. Among other things it sets a short-term interest rate, currently a target range of 3.75% to 4.00%. When inflation runs above its 2% goal, the usual response is to raise that rate, which raises the cost of borrowing, which slows spending, which is meant to bring prices down.
Inflation is running at 3.7%. That is well above target. The thing that had been arguing against raising rates was a weakening job market, because raising rates into rising unemployment risks causing a recession.
This report removed that argument.
So a strong jobs number makes a rate increase more likely, and higher rates generally make stocks less attractive, because safer alternatives start paying more and borrowing costs rise for companies.
Markets now put the odds of a December increase at roughly 75% for a quarter point, with another 15% expecting a half point. The next Fed meeting is December 8 and 9, 2026.
One honest correction to how this is being reported. The odds were already about 73% before the jobs report came out on the morning of Friday, November 6, and 67% on Thursday, November 5. The report moved them a couple of points. It did not create the expectation. Two Fed officials had already dissented in favor of raising rates at the October 28 meeting. The direction was set before Friday, November 6.
What we might have wrong
Three things, and we would rather raise them than have you find them.
The beat may not be a beat. The government publishes a margin of error for its own payroll figure. For a one-month change, the 90% confidence interval is roughly plus or minus 122,300 jobs. The gap between 165,000 and a 60,000 consensus is about 105,000. That is inside the margin. The honest statement is that the number came in high, not that the economy definitively produced 105,000 more jobs than expected.
Average pay is an average, and averages move for boring reasons. If an employer replaces well-paid workers with less well-paid ones, the average hourly wage falls without anyone taking a pay cut. Conversely, if low-wage jobs disappear, the average rises. Some of the slowdown in the pay line is likely composition rather than actual pay restraint. We cannot separate those with the published data.
Pay and prices are not measured over identical periods. The wage figure is October against October. The most recent inflation figure is September against September. We have compared each month to its own matching month in the table above, which is the correct approach, but it means the most recent pair available is September's, and October's comparison does not exist yet.
So, are wages keeping up with inflation?
No, and they have not been since March.
For six consecutive months, April through September 2026, the average hourly wage in the United States grew more slowly than consumer prices. In September the shortfall was 0.7 percentage points, the widest of the six. Over that stretch, the typical hour of work bought less than it did a year earlier, every single month.
That is true at the same time as a labor market adding jobs faster than anyone forecast, with unemployment falling and participation rising. Both things are real. A strong labor market and a shrinking paycheck are not contradictory, because employment counts how many people are working and real wages measure what that work covers. Those are different questions and right now they have different answers.
Whether that becomes seven months depends on a number published on Tuesday, November 10.
What this does not tell you
It does not tell you about your pay. This is a national average across every private employer in the country. Your industry, your region and your own situation can look nothing like it.
It does not tell you a recession is coming. Slowing wage growth alongside strong hiring is an unusual combination, not an established warning. We are describing what happened, not forecasting.
It does not tell you what the Fed will do. Market-implied odds are a measure of what traders currently expect, and they have been wrong many times.
And it does not tell you what any company is worth. Nothing here values anything.
What we would keep is the habit rather than the figure. When a number is reported as growth, the first question is always whether it is before or after prices. A 3% raise in a 2% world and a 3% raise in a 4% world are opposite events wearing the same number, and only one of them leaves you better off.
That is the same reading problem we spend most of our time on. A headline gives you a number. The thing you want to know is almost always what sits underneath it.
Techdamentals does that for companies. It gives you a fair value range rather than one number, puts the fundamentals and the chart in the same place, and digs out the real reason a stock moved after earnings instead of the headline.